1.图像基础
1.1基本概念
(1)像素:计算机屏幕上所能显示的最小单位,用来表示图像的单位
(2)RGB:R:red,G:green,B:Blue,范围:0~255
1.2基本操作
- 读取图片:cv2.imread()
- 读取图片的形状:img.shape,返回一个(rows,height,channels)
- 获取图片的大小:img.size,返回一个rowsXheightXchannels
- 显示图片:cv2.imshow(“名称”,img)
- 等待:cv2.waitKey(0)
- 关闭:cv2.destroyAllWindows()
import cv2 as cv

# 读取赌片
img = cv.imread("image/kids.jpg")

# 获取形状
print(img.shape)

# 获取图片大小
print(img.size)

# 图片的一个像素点的RGB
(b,g,r) = img[6,40]
print(b,g,r)

cv.imshow("图片",img)
cv.waitKey(0)
cv.destroyAllWindows()
1.3灰度图片操作
- 读取图片:cv2.imread(img,cv2.IMREAD_GRAYSCALE)
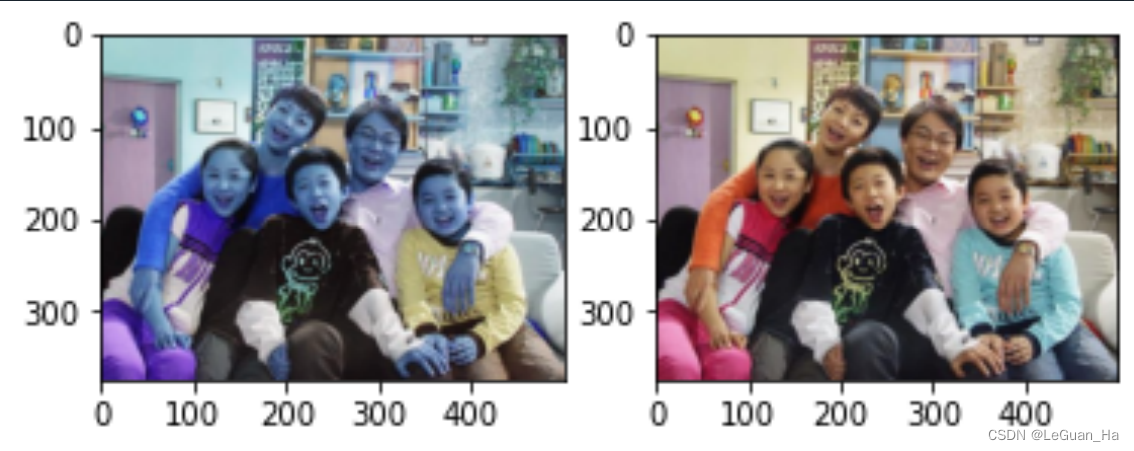
1.4BGR顺序
import cv2 as cv
import matplotlib.pyplot as plt
# 读取赌片
img1 = cv.imread("image/kids.jpg")

# 获取整张图片的b,g,r
b,g,r = cv.split(img1)

# 调整b,g,r的顺序
img2 = cv.merge([r,g,b])

plt.subplot(121)
plt.imshow(img1)
plt.subplot(122)
plt.imshow(img2)

plt.show()
2.图像操作
2.1读取图片
import cv2 as cv

# 加载图片
img = cv.imread("image/kids.jpg")

# 显示图片
cv.imshow("LOGO", img)
cv.waitKey(0)
cv.destroyAllWindows()
2.2读取、处理、保存图片
import cv2 as cv
import matplotlib.pyplot as plt
import argparse

# 获取参数
parser = argparse.ArgumentParser()

# 添加参数
parser.add_argument("img_input", help="read one image")
parser.add_argument("img_output", help="save the process image")

# 解析参数,以字典形式保存参数和值
args = vars(parser.parse_args())

# 加载图片
img = cv.imread(args["img_input"])
# 灰度处理
img_gray = cv.cvtColor(img, cv.COLOR_BGR2GRAY)

# 保存图片
cv.imwrite(args["img_output"], img_gray)

# 显示图片
cv.imshow("Original Image", img)
cv.imshow("Gray Image", img_gray)

cv.waitKey(0)
cv.destroyAllWindows()
3.视频操作
3.1从摄像头读取视频
import cv2 as cv
import argparse

# 获取参数
parser = argparse.ArgumentParser()

# 添加参数
parser.add_argument("index_camera", help="the camera ID", type=int)

# 解析参数
args = parser.parse_args()

print("the camera index:", args.index_camera)

# 捕获摄像头的视频
capture = cv.VideoCapture(args.index_camera)

# 获取帧的宽度
frame_width = capture.get(cv.CAP_PROP_FRAME_WIDTH)
frame_height = capture.get(cv.CAP_PROP_FRAME_HEIGHT)

# fps 每秒闪过照片数量
fps = capture.get(cv.CAP_PROP_FPS)
print("帧的宽度:{}", format(frame_width))
print("帧的高度:{}", format(frame_height))
print("FPS: {}", format(fps))

# 判断摄像头是否打开
if capture.isOpened() is False:
    print("Camera Error!")

# 从摄像头读取视频直到关闭
while capture.isOpened():
    # 通过摄像头捕获帧
    ret, frame = capture.read()
    # 把捕获的帧变成灰度
    gray_frame = cv.cvtColor(frame, cv.COLOR_BGR2GRAY)
    # 显示每一帧
    cv.imshow("frame", frame)
    cv.imshow("gray frame", gray_frame)
    # 键盘输入“q” ,关闭摄像头
    if cv.waitKey(20) & 0xFF == ord("q"):
        break

# 释放资源
capture.release()
# 关闭窗口
cv.destroyAllWindows()
3.2从视频文件读取
import cv2 as cv
import argparse

# 获取参数
parser = argparse.ArgumentParser()

# 添加参数
parser.add_argument("video_path", help="the path to the video file")

# 解析参数
args = parser.parse_args()

# 加载视频文件
capture = cv.VideoCapture(args.video_path)

# 读取视频
ret, frame = capture.read()  # ret 是否读取到了帧
while ret:
    cv.imshow("video", frame)
    ret, frame = capture.read()  # 继续读取
    if cv.waitKey(20) & 0xFF == ord('q'):
        break

# 释放资源
capture.release()
# 关闭
cv.destroyAllWindows()
3.3保存摄像头读取到的视频
import cv2 as cv
import argparse

# 获取参数
parser = argparse.ArgumentParser()

# 添加参数
parser.add_argument("video_output", help="the path to the output video")

# 解析参数
args = parser.parse_args()

# 捕获摄像头
capture = cv.VideoCapture(0)

# 是否打开摄像头
if capture.isOpened() is False:
    print("Camera Error")

# 获取帧的属性:宽 高 以及fps
frame_width = capture.get(cv.CAP_PROP_FRAME_WIDTH)
frame_height = capture.get(cv.CAP_PROP_FRAME_HEIGHT)
fps = capture.get(cv.CAP_PROP_FPS)

# 对视频进行编码
fourcc = cv.VideoWriter_fourcc(*"XVID")
output_gray = cv.VideoWriter(args.video_output, fourcc, int(fps), (int(frame_width), int(frame_height)), False)

# 读取摄像头
while capture.isOpened():
    ret, frame = capture.read()  # 一帧一帧的读取
    if ret is True:
        # 将读取到的帧转换为灰度
        gray_frame = cv.cvtColor(frame, cv.COLOR_BGR2GRAY)
        # 将转换后的帧写入到新的视频文件中
        output_gray.write(gray_frame)
        # 显示视频
        cv.imshow("gray", gray_frame)
        # 等待或按q键退出
        if cv.waitKey(1) & 0xFF == ord('q'):
            break
    else:
        break

# 释放资源
capture.release()
output_gray.release()
cv.destroyAllWindows()
4.图像变换
4.1图像的放大、缩小
import matplotlib.pyplot as plt
import cv2
import matplotlib

matplotlib.use('TkAgg')

img = cv2.imread("image/kids.jpg")
plt.imshow(img)

height, width, channel = img.shape
print(height, width, channel)

# 图片放大、缩小
resized_img = cv2.resize(img, (width * 2, height * 2), interpolation=cv2.INTER_LINEAR)
plt.imshow(resized_img)

# 图片缩小
small_img = cv2.resize(img, None, fx=0.5, fy=0.5, interpolation=cv2.INTER_LINEAR)
plt.imshow(small_img)
4.2图片平移
import matplotlib.pyplot as plt
import cv2
import matplotlib
import numpy as np

matplotlib.use('TkAgg')

img = cv2.imread("image/kids.jpg")

# 图片平移
height, width = img.shape[:2]
M1 = np.float32([[1, 0, 100], [0, 1, 50]])  # 平移矩阵 图像向右平移100个像素,向下平移50个像素
#M1 = np.float32([[1, 0, -100], [0, 1, -50]])  # 平移矩阵 图像向左平移100个像素,向上平移50个像素

move_img = cv2.warpAffine(img, M1, (width, height))
plt.imshow(move_img)
plt.show()
4.3图像旋转
import matplotlib.pyplot as plt
import cv2
import matplotlib
import numpy as np

matplotlib.use('TkAgg')

img = cv2.imread("image/dogsp.jpeg")

# 图像旋转
height, width = img.shape[:2]
center = (width // 2, height // 2)  # 旋转的中心
M3 = cv2.getRotationMatrix2D(center, 180, 1)  # 1表示旋转过程中没有缩放
rotation_img = cv2.warpAffine(img, M3, (width, height))
plt.imshow(rotation_img)
plt.show()
4.4仿射变换
import matplotlib.pyplot as plt
import cv2
import matplotlib
import numpy as np

matplotlib.use('TkAgg')

img = cv2.imread("image/dogsp.jpeg")
height, width = img.shape[:2]

# cv2.getAffineTransform(p1,p2)
p1 = np.float32([[120, 35], [215, 45], [135, 120]])
p2 = np.float32([[135, 45], [300, 110], [130, 230]])
M4 = cv2.getAffineTransform(p1, p2)
trans_img = cv2.warpAffine(img, M4, (width, height))
plt.imshow(trans_img)
plt.show()
4.5图像裁剪
import matplotlib.pyplot as plt
import cv2
import matplotlib
import numpy as np

matplotlib.use('TkAgg')

img = cv2.imread("image/dogsp.jpeg")

crop_img = img[20:500,200:400]
plt.imshow(crop_img)
plt.show()
4.6位运算
-
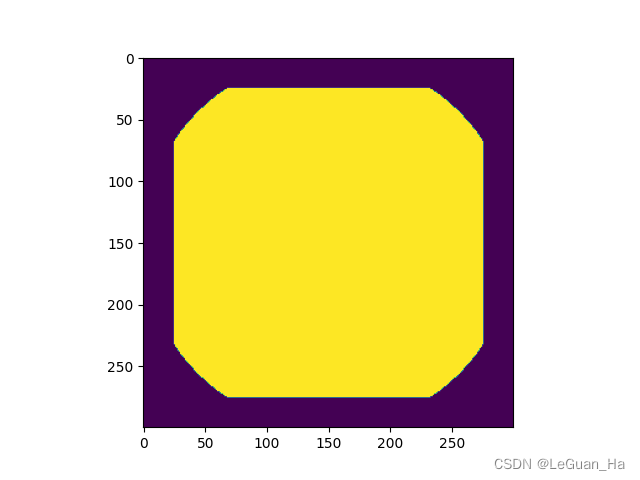
与运算
import matplotlib.pyplot as plt
import cv2
import matplotlib
import numpy as np

matplotlib.use('TkAgg')


# 长方形
rectangle = np.zeros((300, 300), dtype='uint8')
rect_img = cv2.rectangle(rectangle, (25, 25), (275, 275), 255, -1)

# 圆形
rectangle = np.zeros((300, 300), dtype='uint8')
circle_img = cv2.circle(rectangle, (150, 150), 150, 255, -1)


and_img = cv2.bitwise_and(rect_img,circle_img)
plt.imshow(and_img)
plt.show()
-
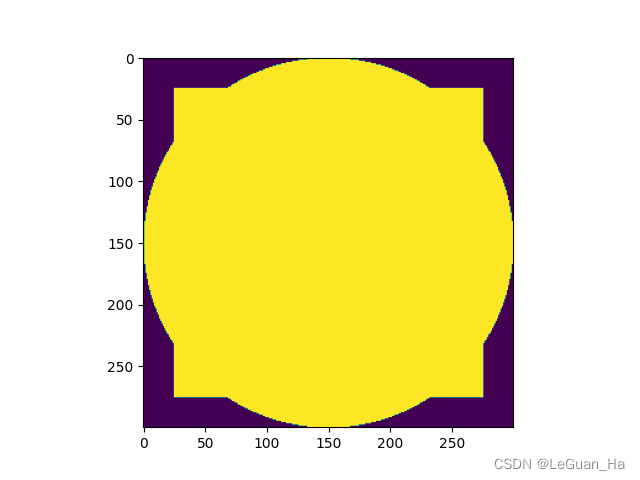
或运算
import matplotlib.pyplot as plt
import cv2
import matplotlib
import numpy as np

matplotlib.use('TkAgg')


# 长方形
rectangle = np.zeros((300, 300), dtype='uint8')
rect_img = cv2.rectangle(rectangle, (25, 25), (275, 275), 255, -1)

# 圆形
rectangle = np.zeros((300, 300), dtype='uint8')
circle_img = cv2.circle(rectangle, (150, 150), 150, 255, -1)


or_img = cv2.bitwise_or(rect_img,circle_img)
plt.imshow(or_img)
plt.show()
-
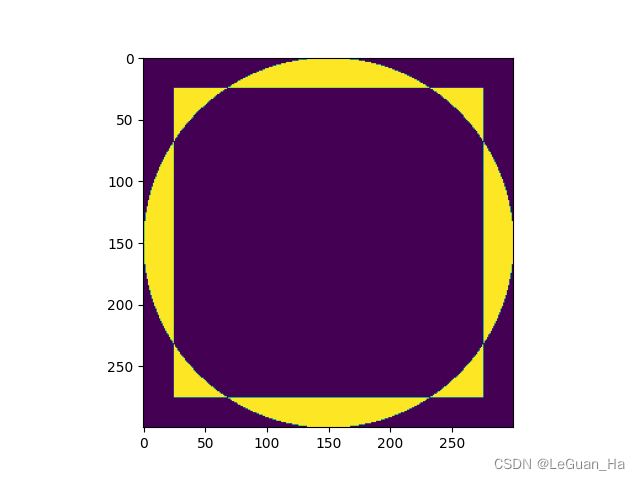
异或运算
import matplotlib.pyplot as plt
import cv2
import matplotlib
import numpy as np

matplotlib.use('TkAgg')


# 长方形
rectangle = np.zeros((300, 300), dtype='uint8')
rect_img = cv2.rectangle(rectangle, (25, 25), (275, 275), 255, -1)

# 圆形
rectangle = np.zeros((300, 300), dtype='uint8')
circle_img = cv2.circle(rectangle, (150, 150), 150, 255, -1)


xor_img = cv2.bitwise_xor(rect_img,circle_img)
plt.imshow(xor_img)
plt.show()
4.7图像分离与融合
import matplotlib.pyplot as plt
import cv2
import matplotlib
import numpy as np

matplotlib.use('TkAgg')


img = cv2.imread("image/kids.jpg")

(B,G,R) = cv2.split(img) # 分离
plt.imshow(B)

zeros = np.zeros(img.shape[:2],dtype='unit8')
plt.imshow(cv2.merge([zeros,zeros,R]))

plt.imshow(cv2.merge([B,zeros,zeros]))
4.8颜色空间
import matplotlib.pyplot as plt
import cv2
import matplotlib
import numpy as np

matplotlib.use('TkAgg')


img = cv2.imread("image/kids.jpg")

# 灰度
gray = cv2.cvtColor(img,cv2.COLOR_BGR2GRAY)
plt.imshow(gray)
plt.show()

# HSV (色度,饱和度,纯度)
hsv = cv2.cvtColor(img,cv2.COLOR_BGR2HSV)
plt.imshow(hsv)
plt.show()

# lab
lab = cv2.cvtColor(img,cv2.COLOR_BGR2LAB)
plt.imshow(lab)
plt.show()
5.灰度直方图
- 直方图是图像中像素强度分布的图形表达方式
- 直方图统计了每一个强度值所具有的像素个数
cv2.calcHist(images,channels,mask,histSize,ranges)
- images:整数类型(unit8和float32)的原图(list形式表示)
- channels:通道的索引,例如[0]代表灰度图片
- mask:计算图片指定区域的直方图,如果mask为none,那么计算整张图片
- histSize(bins):每个色调值(范围:0~255)对应的像素数量/频率
- range:强度值的范围,[0,255]
# 导入库
import cv2
import cv2
import matplotlib.pyplot as plt
import numpy as np


# 方法:显示图片 传入图片 标题 位置
def show_image(image, title, pos):
    # BGR TO RGB
    image_RGB = image[:, :, ::-1]  # (height,width,channel)
    # 显示标题
    plt.title(title)
    plt.subplot(2, 3, pos)  # 定位显示
    plt.imshow(image_RGB)


# 方法:显示图片的灰度直方图
def show_histogram(hist, title, pos, color):
    # 显示标题
    plt.title(title)
    plt.subplot(2, 3, pos)  # 定位图片
    plt.xlabel("Bins")  # 横轴信息
    plt.ylabel("Pixels")  # 纵轴信息
    plt.xlim([0, 256])  # 横轴范围
    plt.plot(hist, color=color)  # 绘制直方图、


# 主函数 main()
def main():
    # 创建画布
    plt.figure(figsize=(15, 6))  # 画布大小
    plt.suptitle("Gray Image Histogram", fontsize=14, fontweight="bold")
    # 加载图片
    img = cv2.imread("cat.jpeg")

    # 灰度转换
    img_gray = cv2.cvtColor(img, cv2.COLOR_BGR2GRAY)

    # 计算灰度直方图
    hist_image = cv2.calcHist([img_gray], [0], None, [256], [0, 256])

    # 展示灰度直方图
    # 灰度图转化成BGR格式图片
    img_BGR = cv2.cvtColor(img_gray, cv2.COLOR_GRAY2BGR)
    show_image(img_BGR, "BGR image", 1)
    show_histogram(hist_image, "gray image histogram", 4, 'm')
    plt.show()


if __name__ == '__main__':
    main()
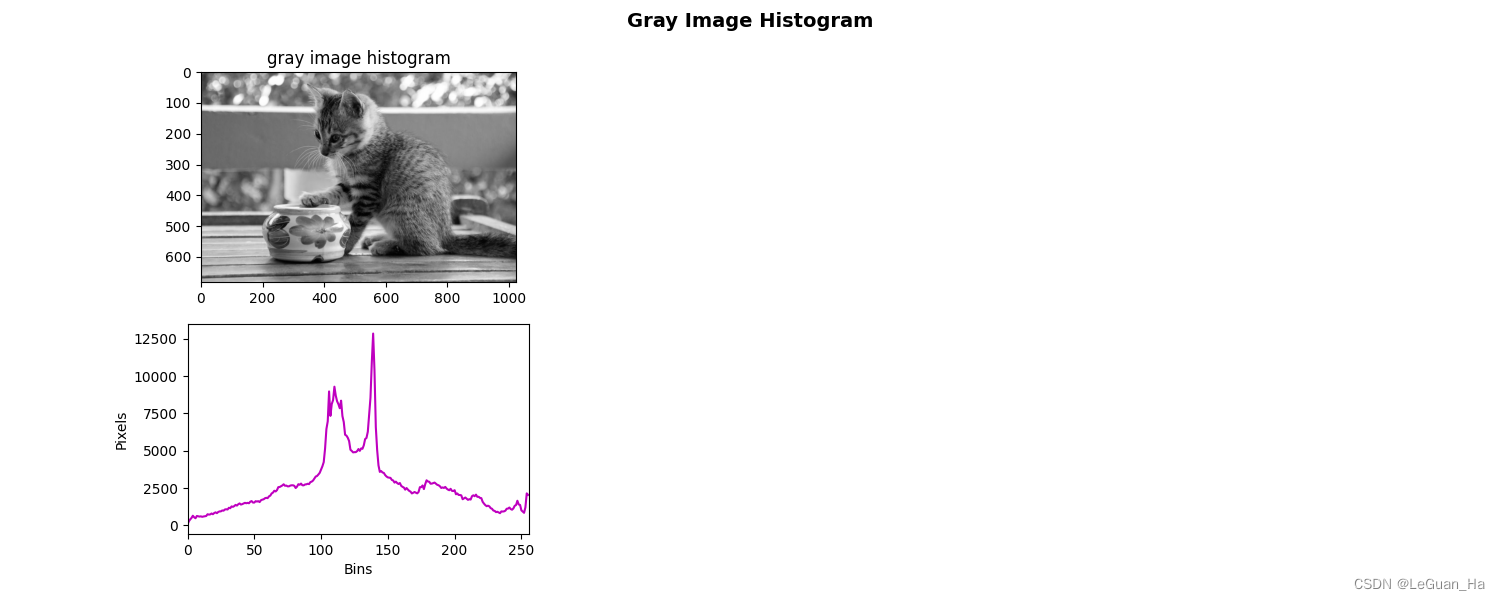
# 导入库
import cv2
import cv2
import matplotlib.pyplot as plt
import numpy as np


# 方法:显示图片 传入图片 标题 位置
def show_image(image, title, pos):
    # BGR TO RGB
    image_RGB = image[:, :, ::-1]  # (height,width,channel)
    # 显示标题
    plt.title(title)
    plt.subplot(2, 3, pos)  # 定位显示
    plt.imshow(image_RGB)


# 方法:显示图片的灰度直方图
def show_histogram(hist, title, pos, color):
    # 显示标题
    plt.title(title)
    plt.subplot(2, 3, pos)  # 定位图片
    plt.xlabel("Bins")  # 横轴信息
    plt.ylabel("Pixels")  # 纵轴信息
    plt.xlim([0, 256])  # 横轴范围
    plt.plot(hist, color=color)  # 绘制直方图、


# 主函数 main()
def main():
    # 创建画布
    plt.figure(figsize=(15, 6))  # 画布大小
    plt.suptitle("Gray Image Histogram", fontsize=14, fontweight="bold")
    # 加载图片
    img = cv2.imread("cat.jpeg")

    # 灰度转换
    img_gray = cv2.cvtColor(img, cv2.COLOR_BGR2GRAY)

    # 计算灰度直方图
    hist_image = cv2.calcHist([img_gray], [0], None, [256], [0, 256])

    # 展示灰度直方图
    # 灰度图转化成BGR格式图片
    img_BGR = cv2.cvtColor(img_gray, cv2.COLOR_GRAY2BGR)
    show_image(img_BGR, "BGR image", 1)
    show_histogram(hist_image, "gray image histogram", 4, 'm')

    # 对图片中的每一个像素值增加50
    M = np.ones(img_gray.shape, np.uint8) * 50  # 构建矩阵
    added_img = cv2.add(img_gray, M)
    added_img_hist = cv2.calcHist([added_img], [0], None, [256], [0, 256])  # 计算直方图
    added_img_BGR = cv2.cvtColor(added_img, cv2.COLOR_GRAY2BGR)
    show_image(added_img_BGR, "added histogram", 2)
    show_histogram(added_img_hist, "added image hist", 5, "m")

    # 对图片中的1每个像素值减去50
    subtract_img = cv2.subtract(img_gray, M)
    subtract_img_hist = cv2.calcHist([subtract_img], [0], None, [256], [0, 256])  # 计算直方图
    subtract_img_BGR = cv2.cvtColor(subtract_img, cv2.COLOR_GRAY2BGR)
    show_image(subtract_img_BGR, "subtracted image", 3)
    show_histogram(subtract_img_hist, "subtracted image hist", 6, 'm')

    plt.show()


if __name__ == '__main__':
    main()
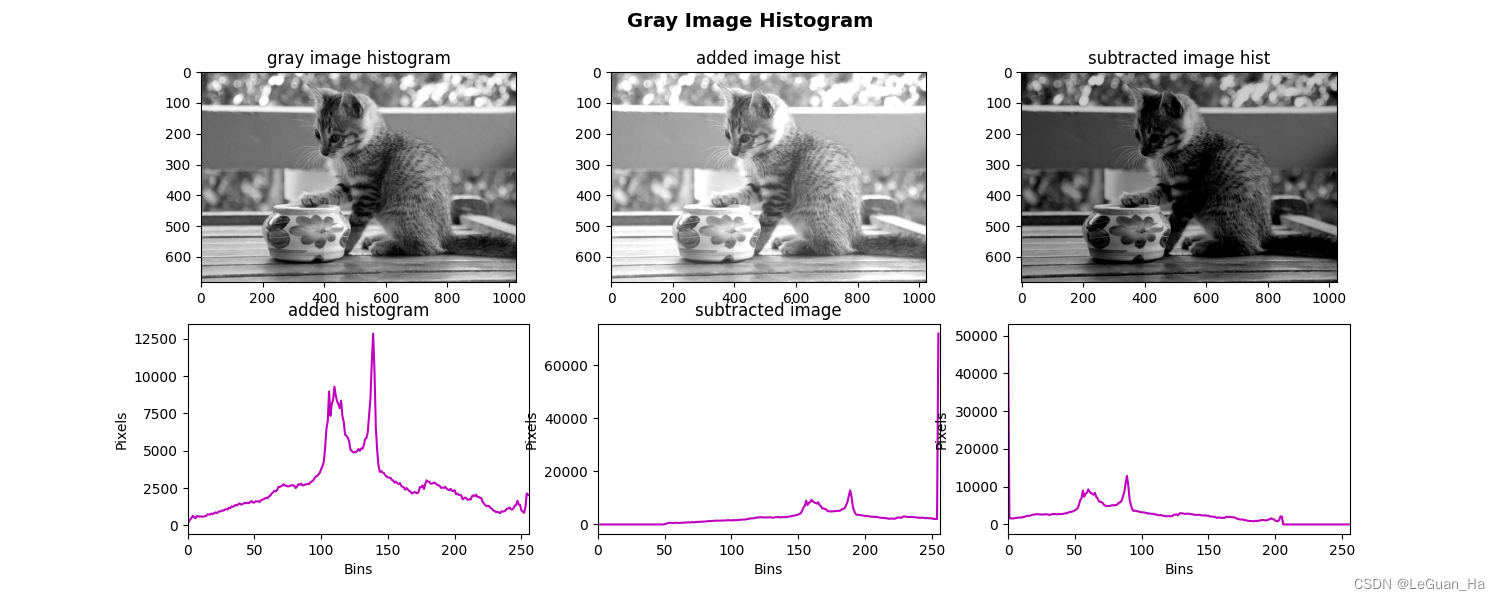
1.mask
- 提取感兴趣的区域
# 1 导入库
import cv2
import matplotlib.pyplot as plt
import numpy as np

# 2 方法:显示图片
def show_image(image, title, pos):
    img_RGB = image[:, :, ::-1] # BGR to RGB
    plt.title(title)
    plt.subplot(2, 2, pos)
    plt.imshow(img_RGB)

# 3 方法:显示灰度直方图
def show_histogram(hist, title, pos, color):
    plt.subplot(2, 2, pos)
    plt.title(title)
    plt.xlim([0, 256])
    plt.plot(hist, color=color)

# 4 主函数
def main():
    # 5 创建画布
    plt.figure(figsize=(12, 7))
    plt.suptitle("Gray Image and Histogram with mask", fontsize=4, fontweight="bold")

    # 6 读取图片并灰度转换,计算直方图,显示
    img_gray = cv2.imread("cat.jpeg", cv2.COLOR_BGR2GRAY) # 读取并进行灰度转换
    img_gray_hist = cv2.calcHist([img_gray], [0], None, [256], [0, 256]) # 计算直方图
    show_image(img_gray, "image gray", 1)
    show_histogram(img_gray_hist, "image gray histogram", 2, "m")

    # 7 创建mask,计算位图,直方图
    mask = np.zeros(img_gray.shape[:2], np.uint8)
    mask[130:500, 600:1400] = 255 # 获取mask,并赋予颜色
    img_mask_hist = cv2.calcHist([img_gray], [0], mask, [256], [0, 256]) # 计算mask的直方图

    # 8 通过位运算(与预算)计算带有mask的灰度图片
    mask_img = cv2.bitwise_and(img_gray, img_gray, mask = mask)

    # 9 显示带有mask的图片和直方图
    show_image(mask_img, "gray image with mask", 3)
    show_histogram(img_mask_hist, "histogram with masked gray image", 4, "m")

    plt.show()
if __name__ == '__main__':
    main()
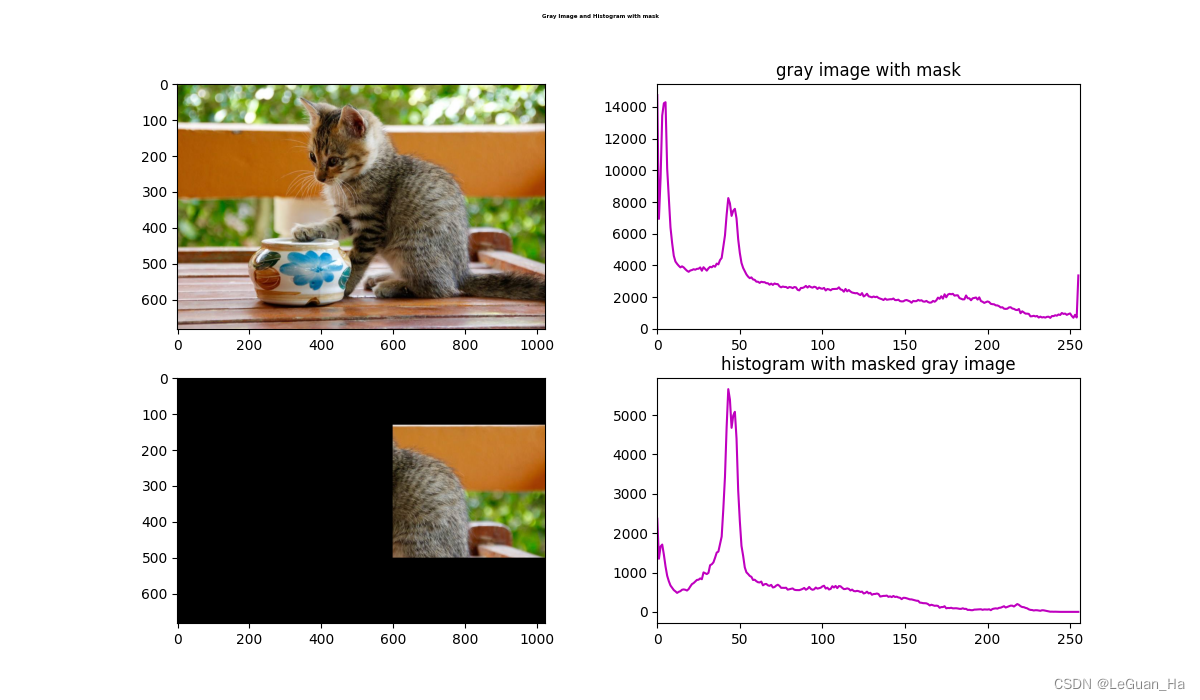
6.彩色直方图
# 1 导入库
import cv2
import matplotlib.pyplot as plt
import numpy as np


# 2 方法:显示图片
def show_image(image, title, pos):
    plt.subplot(3, 2, pos)
    plt.title(title)
    image_RGB = image[:, :, ::-1]  # BGR to RGB
    plt.imshow(image_RGB)
    plt.axis("off")


# 3 方法:显示彩色直方图 b, g, r
def show_histogram(hist, title, pos, color):
    plt.subplot(3, 2, pos)
    plt.title(title)
    plt.xlim([0, 256])
    for h, c in zip(hist, color):  # color: ('b', 'g', 'r')
        plt.plot(h, color=c)


# 4 方法:计算直方图
def calc_color_hist(image):
    # b, g, r
    hist = []
    hist.append(cv2.calcHist([image], [0], None, [256], [0, 256]))
    hist.append(cv2.calcHist([image], [1], None, [256], [0, 256]))
    hist.append(cv2.calcHist([image], [2], None, [256], [0, 256]))
    return hist


# 5 主函数
def main():
    # 5.1 创建画布
    plt.figure(figsize=(12, 8))
    plt.suptitle("Color Histogram", fontsize=4, fontweight="bold")

    # 5.2 读取原图片
    img = cv2.imread("cat.jpeg")

    # 5.3 计算直方图
    img_hist = calc_color_hist(img)

    # 5.4 显示图片和直方图
    show_image(img, "RGB Image", 1)
    show_histogram(img_hist, "RGB Image Hist", 2, ('b', 'g', 'r'))

    # 5.5 原始图片中的每个像素增加50个像素值
    M = np.ones(img.shape, dtype="uint8") * 50

    added_image = cv2.add(img, M)  # 像素一一对应相加
    added_image_hist = calc_color_hist(added_image)
    show_image(added_image, 'added image', 3)
    show_histogram(added_image_hist, 'added image hist', 4, ('b', 'g', 'r'))

    # 5.6 原始图片中的每个像素减去50个像素值
    subtracted_image = cv2.subtract(img, M)
    subtracted_image_hist = calc_color_hist(subtracted_image)
    show_image(subtracted_image, 'subtracted image', 5)
    show_histogram(subtracted_image_hist, 'subtracted image hist', 6, ('b', 'g', 'r'))

    plt.show()


if __name__ == '__main__':
    main()
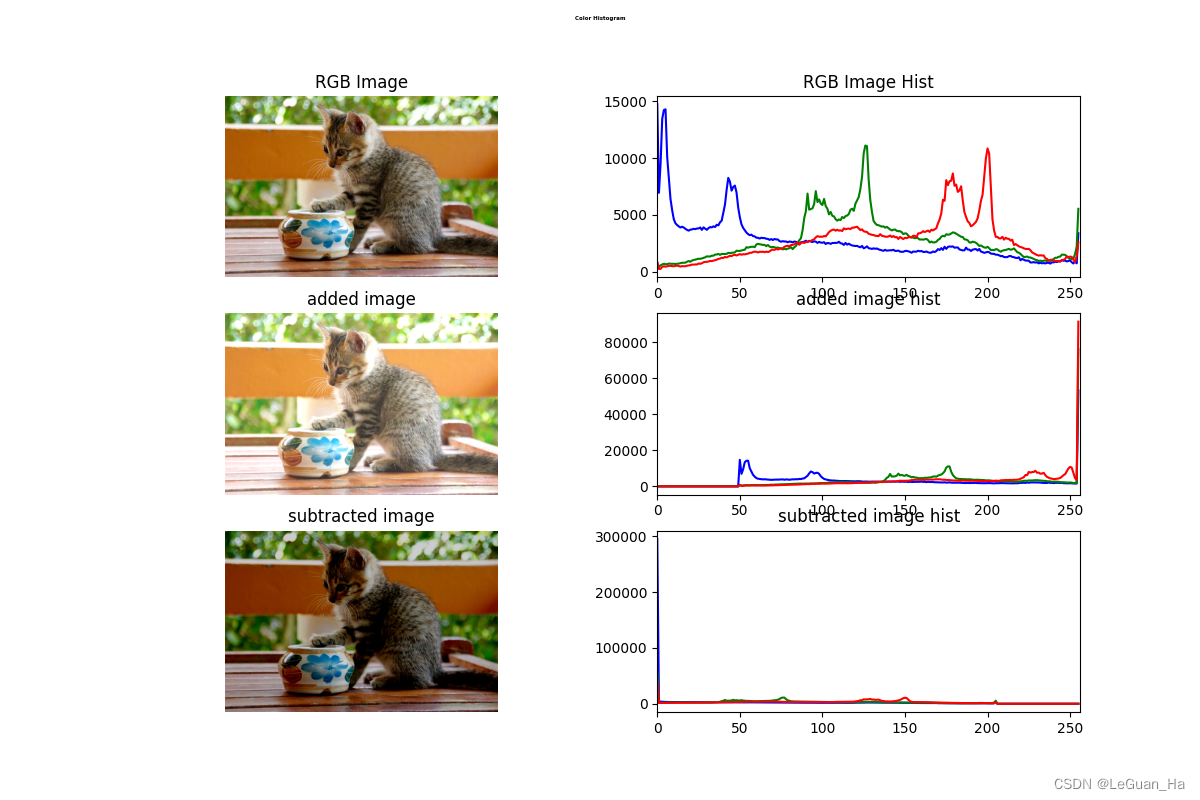
7.画出图形
import cv2
import numpy as np
import matplotlib.pyplot as plt

# 定义颜色(字典形式)
colors = {
    'blue': (255, 0, 0),
    'green': (0, 255, 0),
    'red': (0, 0, 255),
    'yellow': (0, 255, 255),
    'white': (255, 255, 255)
}


# 显示图像
def show_image(image, title):
    img_RGB = image[:, :, ::-1]
    plt.title(title)
    plt.imshow(img_RGB)
    plt.show()
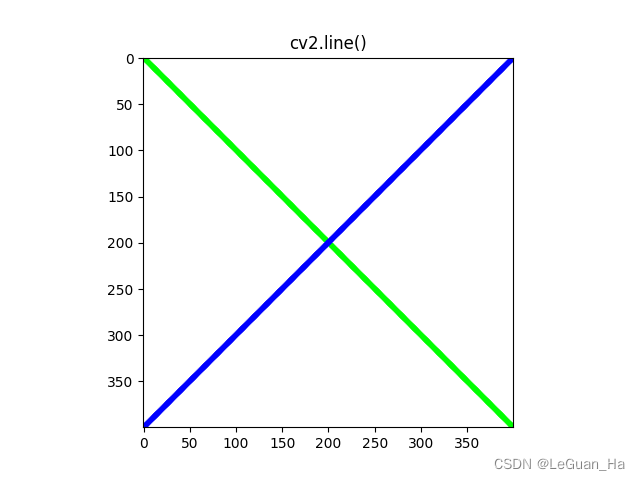
1.直线
# 创建画布
canvas = np.zeros((400, 400, 3), np.uint8)  # 默认背景是黑色
canvas[:] = colors['white']
show_image(canvas, "Background")

# 画直线
cv2.line(canvas, (0, 0), (400, 400), colors['green'], 5)
cv2.line(canvas, (0, 400), (400, 0), colors['blue'], 5)
show_image(canvas, "cv2.line()")
2.长方形
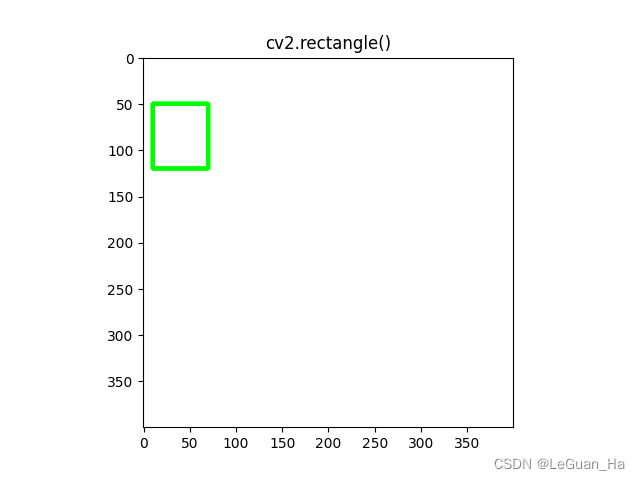
# 长方形
# 创建画布
canvas = np.zeros((400, 400, 3), np.uint8)  # 默认背景是黑色
canvas[:] = colors['white']
show_image(canvas, "Background")

cv2.rectangle(canvas, (10, 50), (70, 120), colors['green'], 3)  # -1为填充
show_image(canvas, "cv2.rectangle()")
3.圆形
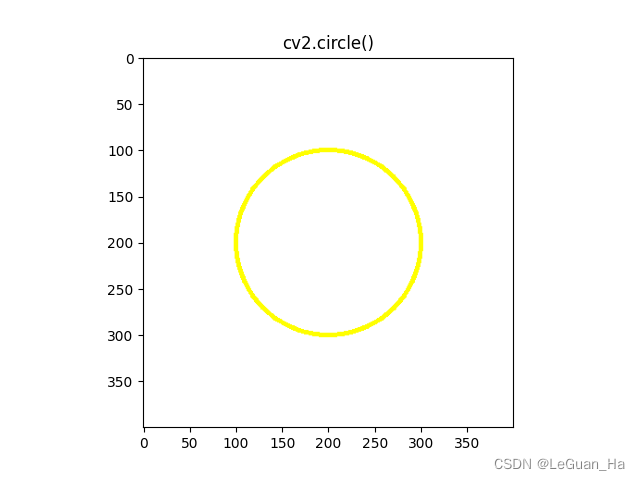
# 圆形
# 创建画布
canvas = np.zeros((400, 400, 3), np.uint8)  # 默认背景是黑色
canvas[:] = colors['white']
show_image(canvas, "Background")

cv2.circle(canvas, (200, 200), 100, colors['yellow'], 3)  # -1为填充
show_image(canvas, "cv2.circle()")
4.折线
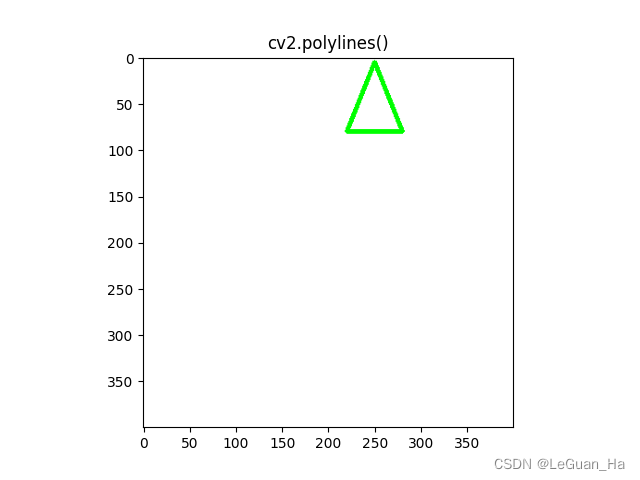
# 折线
# 创建画布
canvas = np.zeros((400, 400, 3), np.uint8)  # 默认背景是黑色
canvas[:] = colors['white']
show_image(canvas, "Background")

pts = np.array([[250, 5], [220, 80], [280, 80]], np.int32)
pts = pts.reshape((-1, 1, 2))
cv2.polylines(canvas, [pts], True, colors['green'], 3)
show_image(canvas, "cv2.polylines()")
8.图片上显示文本
文本类型
- FONT_HERSHEY_SIMPLEX:正常大小无衬线字体
- FONT_HERSHEY_PLAIN:小号无衬线字体
- FONT_HERSHEY_DUPLEX:正常大小无衬线字体,比FONT_HERSHEY_SIMPLEX更复杂
- FONT_HERSHEY_COMPLEX:正常大小有衬线字体
- FONT_HERSHEY_TRIPLEX:正常大小有衬线字体,比FONT_HERSHEY_COMPLEX更复杂
- FONT_HERSHEY_COMPLEX_SMALL:FONT_HERSHEY_COMPLEX的小译本
- FONT_HERSHEY_SCRIPT_SIMPLEX:手写风格字体
- FONT_HERSHEY_SCRIPT_COMPLEX:手写风格字体
import matplotlib.pyplot as plt
import numpy as np

# 定义颜色(字典形式)
colors = {
    'blue': (255, 0, 0),
    'green': (0, 255, 0),
    'red': (0, 0, 255),
    'yellow': (0, 255, 255),
    'white': (255, 255, 255)
}


# 方法:显示图片
def show_image(image, title):
    # BGR->RGB
    image_RGB = image[:, :, ::-1]
    plt.title(title)
    plt.imshow(image_RGB)
    plt.show()


# 创建画布
canvas = np.zeros((400, 400, 3), np.uint8)  # 默认背景黑色
canvas.fill(255)  # canvas[:] = canvas['XXX']

# 往画布上输入文本
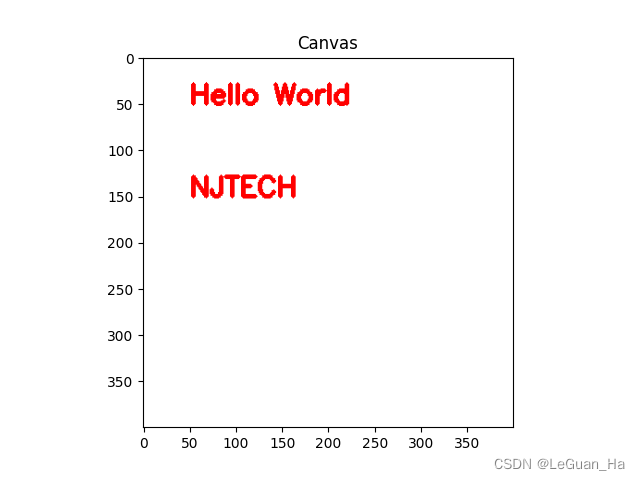
cv2.putText(canvas, "Hello World", (50, 50), cv2.FONT_HERSHEY_SIMPLEX, 1, colors['red'], cv2.LINE_4)
cv2.putText(canvas, "NJTECH ", (50, 150), cv2.FONT_HERSHEY_SIMPLEX, 1, colors['red'], cv2.LINE_4)
show_image(canvas, "Canvas")
9.人脸识别
Haar Cascade哈尔级联
核心原理:
- 使用haar-like特征做检测
- Integral Image:积分图加速特征计算
- AdaBoost:选择关键特征,进行人脸和非人脸分类
- Cascade:级联,弱分类器称为强分类器
# 1 导入库
import cv2
import numpy as np
import matplotlib.pyplot as plt

# 2 方法:显示图片
def show_iamge(image, title, pos):
    # BGR to RGB
    img_RGB = image[:,:,::-1]
    plt.subplot(2, 2, pos)
    plt.title(title)
    plt.imshow(img_RGB)
    plt.axis("off")


# 3 方法:绘制图片中检测到的人脸
def plot_rectangle(image, faces):
    # 拿到检测到的人脸数据,返回4个值:坐标(x,y), 宽高width, height
    for (x, y, w, h) in faces:
        cv2.rectangle(image, (x, y), (x+w, y+h), (255, 0, 0), 3)
    return image

# 4 主函数
def main():
    #  5 读取一张图片
    image = cv2.imread("family.jpg")

    # 6 转换成灰度图片
    gray = cv2.cvtColor(image, cv2.COLOR_BGR2GRAY)

    # 7 通过OpenCV自带的方法cv2.CascadeClassifier()加载级联分类器
    face_alt2 = cv2.CascadeClassifier("haarcascade_frontalface_alt2.xml")

    # 8 通过第7步,对图像中的人脸进行检测
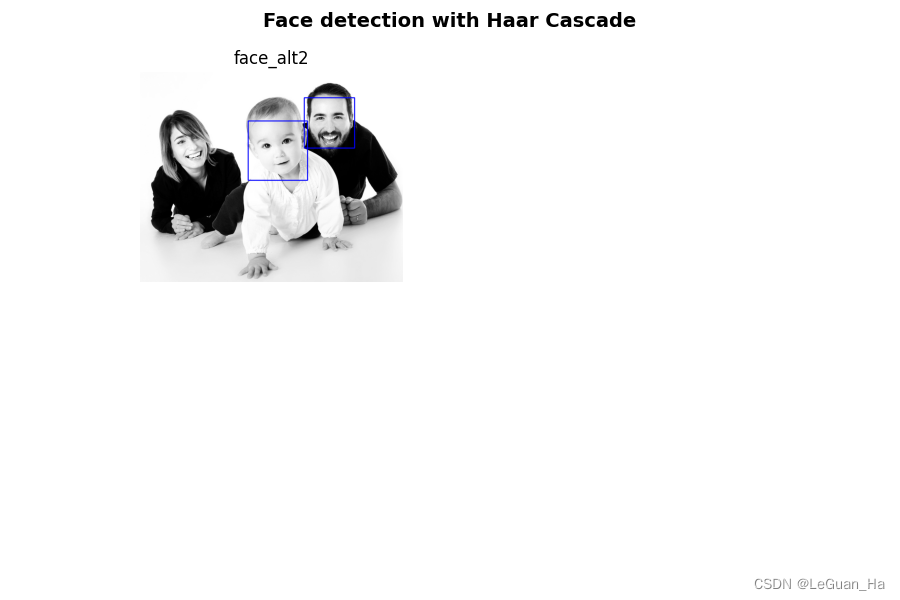
    face_alt2_detect = face_alt2.detectMultiScale(gray)

    # 9 绘制图片中检测到的人脸
    face_alt2_result = plot_rectangle(image.copy(), face_alt2_detect)

    # 10 创建画布
    plt.figure(figsize=(9, 6))
    plt.suptitle("Face detection with Haar Cascade", fontsize=14, fontweight="bold")

    # 11 最终显示整个检测效果
    show_iamge(face_alt2_result, "face_alt2", 1)

    plt.show()
# 12 主程序入口
if __name__ == '__main__':
    main()
通过视频(摄像头)检测人脸:
#  导入库
import cv2

#  方法:绘制图片中检测到的人脸
def plot_rectangle(image, faces):
    # 拿到检测到的人脸数据,返回4个值:坐标(x,y), 宽高width, height
    for (x, y, w, h) in faces:
        cv2.rectangle(image, (x, y), (x+w, y+h), (255, 0, 0), 3)
    return image

# 主函数
def main():
    #  读取摄像头
    capture = cv2.VideoCapture(0)

    # 通过OpenCV自带的方法cv2.CascadeClassifier()加载级联分类器
    face_alt2 = cv2.CascadeClassifier("haarcascade_frontalface_alt2.xml")

    # 判断摄像头是否正常工作
    if capture.isOpened() is False:
        print("Camera Error !")

    while True:
        # 获取每一帧
        ret, frame = capture.read()
        if ret:
            # 灰度转换
            gray = cv2.cvtColor(frame, cv2.COLOR_BGR2GRAY)
            # 对图像中的人脸进行检测
            face_alt2_detect = face_alt2.detectMultiScale(gray)

            # 绘制图片中检测到的人脸
            face_alt2_result = plot_rectangle(frame.copy(), face_alt2_detect)

            cv2.imshow("face detection", face_alt2_result)

            if cv2.waitKey(10) & 0xFF == ord('q'):
                break

    capture.release()
    cv2.destroyWindow()

# 主程序入口
if __name__ == '__main__':
    main()
10.基于dlib进行人脸识别
Dlib对于人脸特征提取支持很好,有很多训练好的人脸特征提取模型供开发者使用,所以Dlib人脸识别开发很适合做人脸项目开发。
HOG方向梯度直方图
- HOG是一种特征描述子,通常用于从图像数据中提取特征。它广泛用于计算机视觉任务的物体检测
- 特征描述子的作用:它是图像的简化表示,仅包含有关图像的重要信息。
# 1 导入库
import cv2
import dlib
import numpy as np
import matplotlib.pyplot as plt

# 2 方法:显示图片
def show_image(image, title):
    img_RGB = image[:, :, ::-1] # BGR to RGB
    plt.title(title)
    plt.imshow(img_RGB)
    plt.axis("off")

# 3 方法:绘制人脸矩形框
def plot_rectangle(image, faces):
    for face in faces:
        cv2.rectangle(image, (face.left(), face.top()), (face.right(), face.bottom()), (255,0,0), 4)
    return image

def main():
    # 4 读取一张图片
    img = cv2.imread("family.jpg")

    # 5 灰度转换
    gray = cv2.cvtColor(img, cv2.COLOR_BGR2GRAY)

    # 6 调用dlib库中的检测器
    detector = dlib.get_frontal_face_detector()
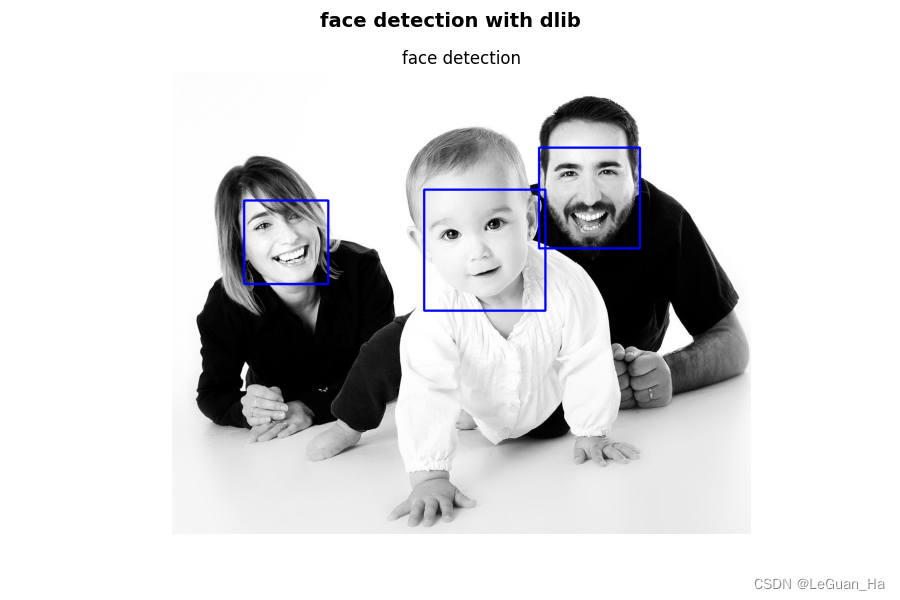
    dets_result = detector(gray, 1) # 1 :代表将图片放大一倍
    # 7 给检测出的人脸绘制矩形框
    img_result = plot_rectangle(img.copy(), dets_result)

    # 8 创建画布
    plt.figure(figsize=(9, 6))
    plt.suptitle("face detection with dlib", fontsize=14, fontweight="bold")

    # 9 显示最终的检测效果
    show_image(img_result, "face detection")

    plt.show()

if __name__ == '__main__':
    main()
通过视频(摄像头)检测人脸:
# 1 导入库
import cv2
import dlib

# 2 方法:绘制人脸矩形框
def plot_rectangle(image, faces):
    for face in faces:
        cv2.rectangle(image, (face.left(), face.top()), (face.right(), face.bottom()), (255,0,0), 4)
    return image

def main():
    # 3 打开摄像头,读取视频
    capture = cv2.VideoCapture(0)
    # 4 判断摄像头是否正常工作
    if capture.isOpened() is False:
        print("Camera Error !")
    # 5 摄像头正常打开:循环读取每一帧
    while True:
        ret, frame = capture.read()
        if ret:
            gray = cv2.cvtColor(frame, cv2.COLOR_BGR2GRAY) # BGR to GRAY

            # 6 调用dlib库中的检测器
            detector = dlib.get_frontal_face_detector()
            det_result = detector(gray, 1)
            # 7 绘制检测结果
            dets_image = plot_rectangle(frame, det_result)

            # 8 实时显示最终的检测效果
            cv2.imshow("face detection with dlib", dets_image)

            # 9 按键"ESC",退出,关闭摄像头
            if cv2.waitKey(1) == 27:
                break

    # 10 释放所有的资源
    capture.release()
    cv2.destroyAllWindows()

if __name__ == '__main__':
    main()
11.关键点检测
人脸关键点检测——dlib
# 1 加入库
import cv2
import matplotlib.pyplot as plt
import dlib

# 2 读取一张图片
image = cv2.imread("Tom2.jpeg")

# 3 调用人脸检测器
detector = dlib.get_frontal_face_detector()

# 4 加载预测关键点模型(68个关键点)
predictor = dlib.shape_predictor("shape_predictor_68_face_landmarks.dat")

# 5 灰度转换
gray = cv2.cvtColor(image, cv2.COLOR_BGR2GRAY)

# 6 人脸检测
faces = detector(gray, 1)

# 7 循环,遍历每一张人脸,给人脸绘制矩形框和关键点
for face in faces: #(x, y, w, h)
    # 8 绘制矩形框
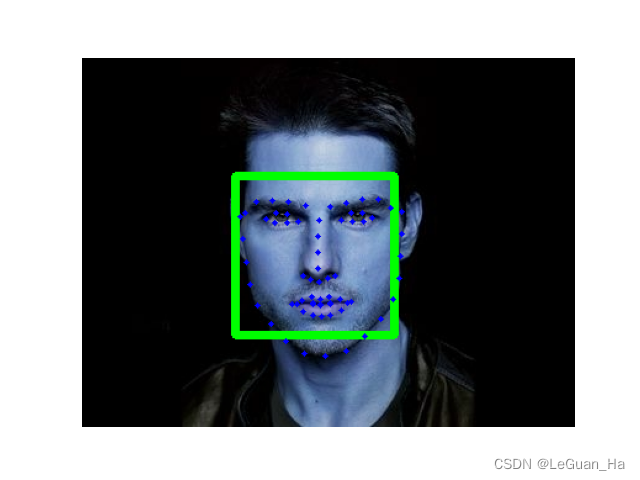
    cv2.rectangle(image, (face.left(), face.top()), (face.right(), face.bottom()), (0,255,0), 5)

    # 9 预测关键点
    shape = predictor(image, face)

    # 10 获取到关键点坐标
    for pt in shape.parts():
        # 获取横纵坐标
        pt_position = (pt.x, pt.y)
        # 11 绘制关键点坐标
        cv2.circle(image, pt_position, 2, (0, 0, 255), -1)

# 12 显示整个效果图
plt.imshow(image)
plt.axis("off")
plt.show()
通过摄像头获取人脸的关键点:
# 1 加入库
import cv2
import dlib

# 2 打开摄像头
capture = cv2.VideoCapture(0)

# 3 获取人脸检测器
detector = dlib.get_frontal_face_detector()

# 4 获取人脸关键点检测模型
predictor = dlib.shape_predictor("shape_predictor_68_face_landmarks.dat")

while True:
    # 5 读取视频流
    ret, frame = capture.read()
    # 6 灰度转换
    gray = cv2.cvtColor(frame, cv2.COLOR_BGR2GRAY)
    # 7 人脸检测
    faces = detector(gray, 1)
    # 8 绘制每张人脸的矩形框和关键点
    for face in faces:
        # 8.1 绘制矩形框
        cv2.rectangle(frame, (face.left(), face.top()), (face.right(), face.bottom()), (0,255,0), 3)
        # 8.2 检测到关键点
        shape = predictor(gray, face)
        # 8.3 获取关键点的坐标
        for pt in shape.parts():
            # 每个点的坐标
            pt_position = (pt.x, pt.y)
            # 8.4 绘制关键点
            cv2.circle(frame, pt_position, 3, (255,0,0), -1)
    if cv2.waitKey(1) & 0xFF == ord('q'):
        break
    # 9 显示效果
    cv2.imshow("face detection landmark", frame)
capture.release()
cv2.destroyAllWindows()
基于face_recognition进行人脸关键点检测
face_recognition 使用世界上最简单的人脸识别工具,它使用dlib最先进的人脸识别技术构建而成,并具有深度学习功能
# 1 加入库
import face_recognition
import cv2
import matplotlib.pyplot as plt

# 2 方法:显示图片
def show_image(image, title):
    plt.title(title)
    plt.imshow(image)
    plt.axis("off")

# 3 方法:绘制Landmars关键点
def show_landmarks(image, landmarks):
    for landmarks_dict in landmarks:
        for landmarks_key in landmarks_dict.keys():
            for point in landmarks_dict[landmarks_key]:
                cv2.circle(image, point, 2, (0,0,255), -1)
    return image
# 4 主函数
def main():
    # 5 读取图片
    image = cv2.imread("Tom.jpeg")
    # 6 图片灰度转换
    gray = cv2.cvtColor(image, cv2.COLOR_BGR2GRAY)
    # 7 调用face_recognition库中的方法:face_landmarks()
    face_marks = face_recognition.face_landmarks(gray, None, "large")
    print(face_marks)
    # 8 绘制关键点
    img_result = show_landmarks(image.copy(), face_marks)
    # 9 创建画布
    plt.figure(figsize=(9,6))
    plt.suptitle("Face Landmarks with face_recognition", fontsize=14, fontweight="bold")
    # 10 显示整体效果
    show_image(img_result, "landmarks")

    plt.show()

if __name__ == '__main__':
    main()
12.目标跟踪
1.基于dlib库 —— 检测人脸、跟踪人脸
# 加入库
import cv2
import dlib


# 主函数
def main():
    # 打开摄像头
    capture = cv2.VideoCapture(0)

    # 基于dlib获取人脸检测器
    detector = dlib.get_frontal_face_detector()

    # 基于dlib库实时跟踪
    tractor = dlib.correlation_tracker()

    # tracking_state 跟踪状态
    tracking_state = False

    # 循环读取每一帧
    while True:
        ret, frame = capture.read()

        # 如果没有跟踪,启动跟踪器
        if tracking_state is False:
            gray = cv2.cvtColor(frame, cv2.COLOR_BGR2GRAY)
            dets = detector(gray, 1)  # 返回检测到的人脸
            if len(dets) > 0:
                tractor.start_track(frame, dets[0])
                tracking_state = True

        # 正在跟踪,实时获取人脸的位置,显示
        if tracking_state is True:
            tractor.update(frame)  # 更新画面
            position = tractor.get_position()  # 获取人脸坐标
            cv2.rectangle(frame, (int(position.left()), int(position.top())),
                          (int(position.right()), int(position.bottom())), (0, 255, 0), 3)

        key = cv2.waitKey(20) & 0xFF

        if key == ord('q'):
            break

        cv2.imshow("face tracking",frame)

    capture.release()
    cv2.destroyAllWindows()


if __name__ == '__main__':
    main()
增加保存视频以及显示提示信息后代码:
# 加入库
import cv2
import dlib


# 增加功能二:信息提示
def show_info(frame, tracking_state):
    pos1 = (20, 40)
    pos2 = (20, 80)
    cv2.putText(frame, "'1':reset", pos1, cv2.FONT_HERSHEY_COMPLEX, 0.5, (255, 255, 255))
    # 根据状态显示不同的信息
    if tracking_state is True:
        cv2.putText(frame,"tracking now ...",pos2,cv2.FONT_HERSHEY_COMPLEX, 0.5, (255, 0, 0))
    else:
        cv2.putText(frame, "no tracking ...", pos2, cv2.FONT_HERSHEY_COMPLEX, 0.5, (0, 255, 0))

# 主函数
def main():
    # 打开摄像头
    capture = cv2.VideoCapture(0)

    # 基于dlib获取人脸检测器
    detector = dlib.get_frontal_face_detector()

    # 基于dlib库实时跟踪
    tractor = dlib.correlation_tracker()

    # tracking_state 跟踪状态
    tracking_state = False

    # 增加功能一:保存视频
    frame_width = capture.get(cv2.CAP_PROP_FRAME_WIDTH)
    frame_height = capture.get(cv2.CAP_PROP_FRAME_HEIGHT)
    frame_fps = capture.get(cv2.CAP_PROP_FPS)
    # 设置视频格式
    # 对视频进行编码
    fourcc = cv2.VideoWriter_fourcc(*"XVID")
    output = cv2.VideoWriter("record.avi", fourcc, int(frame_fps), (int(frame_width), int(frame_height)), True)

    # 循环读取每一帧
    while True:
        ret, frame = capture.read()

        # 显示提示信息
        show_info(frame,tracking_state)
        # 如果没有跟踪,启动跟踪器
        if tracking_state is False:
            gray = cv2.cvtColor(frame, cv2.COLOR_BGR2GRAY)
            dets = detector(gray, 1)  # 返回检测到的人脸
            if len(dets) > 0:
                tractor.start_track(frame, dets[0])
                tracking_state = True

        # 正在跟踪,实时获取人脸的位置,显示
        if tracking_state is True:
            tractor.update(frame)  # 更新画面
            position = tractor.get_position()  # 获取人脸坐标
            cv2.rectangle(frame, (int(position.left()), int(position.top())),
                          (int(position.right()), int(position.bottom())), (0, 255, 0), 3)

        key = cv2.waitKey(20) & 0xFF

        if key == ord('q'):
            break

        if key == ord('1'):
            tracking_state = False

        cv2.imshow("face tracking", frame)
        # 保存视频
        output.write(frame)

    capture.release()
    cv2.destroyAllWindows()


if __name__ == '__main__':
    main()
2.基于dlib库 —— 选定目标物体,跟踪目标
# 1 加入库
import cv2
import dlib

# 定义方法:显示信息
def show_info(frame, tracking_state):
    pos1 = (10, 20)
    pos2 = (10, 40)
    pos3 = (10, 60)

    info1 = "put left button, select an area, starct tracking"
    info2 = " '1' : starct tracking ,  '2' : stop tacking , 'q' : exit "
    cv2.putText(frame, info1, pos1, cv2.FONT_HERSHEY_COMPLEX, 0.5, (255,255,255))
    cv2.putText(frame, info2, pos2, cv2.FONT_HERSHEY_COMPLEX, 0.5, (255,255,255))
    if tracking_state:
        cv2.putText(frame, "tracking now ...", pos3, cv2.FONT_HERSHEY_COMPLEX, 0.5, (255,0,0))
    else:
        cv2.putText(frame, "stop tracking ...", pos3, cv2.FONT_HERSHEY_COMPLEX, 0.5, (0,255,0))

# 存放鼠标事件的坐标点
points = []

# 定义方法:鼠标点击的事件
def mouse_event_handler(event, x, y, flags, parms):
    global points # 全局调用
    if event == cv2.EVENT_LBUTTONDOWN: # 鼠标左键按下
        points = [(x, y)]
    elif event == cv2.EVENT_LBUTTONUP: #  鼠标左键松开
        points.append((x,y))

# 2 打开摄像头
capture = cv2.VideoCapture(0)

# 3 设定窗口名称
nameWindow = "Ojbect Tracking"

# 4 将鼠标事件绑定到窗口上去
cv2.namedWindow(nameWindow)
cv2.setMouseCallback(nameWindow, mouse_event_handler)

# 5 启动跟踪器 dlib.correlation_tracker()
tracker = dlib.correlation_tracker()

# 6 假设跟踪状态
tracking_state = False

# 7 循环读取视频流
while True:
    # 8 获取每一帧
    ret, frame = capture.read()
    # 9 显示提示信息:调用方法
    show_info(frame, tracking_state)
    # 10 如果获取到的坐标点为2个,那么就绘制出矩形框,以及也要让dlib的rectangle()知道坐标点在哪里
    if len(points) == 2 :
        cv2.rectangle(frame, points[0], points[1], (0,255,0), 3) # points[0] : (x,y), points[1] : (x,y)
        dlib_rect = dlib.rectangle(points[0][0], points[0][1], points[1][0], points[1][1])
    # 11 判断:如果跟踪状态为True, 那么,更新跟踪,获取位置,绘制矩形框
    if tracking_state is True:
        tracker.update(frame) # 更新画面
        pos = tracker.get_position() # 获取位置的坐标
        cv2.rectangle(frame, (int(pos.left()),int(pos.top())), (int(pos.right()), int(pos.bottom())), (255, 0, 0), 3)

    # 12 事件判断,根据按键:'1', '2', 'q'
    key = cv2.waitKey(1) & 0xFF

    if key == ord('1'):
        if len(points) == 2:
            tracker.start_track(frame, dlib_rect)
            tracking_state = True
            points = []

    if key == ord('2'):
        points = []
        tracking_state = False

    if key == ord('q'):
        break

    # 13 显示整体效果
    cv2.imshow(nameWindow, frame)

capture.release()
cv2.destroyAllWindows()

v2.EVENT_LBUTTONUP: #  鼠标左键松开
        points.append((x,y))

# 2 打开摄像头
capture = cv2.VideoCapture(0)

# 3 设定窗口名称
nameWindow = "Ojbect Tracking"

# 4 将鼠标事件绑定到窗口上去
cv2.namedWindow(nameWindow)
cv2.setMouseCallback(nameWindow, mouse_event_handler)

# 5 启动跟踪器 dlib.correlation_tracker()
tracker = dlib.correlation_tracker()

# 6 假设跟踪状态
tracking_state = False

# 7 循环读取视频流
while True:
    # 8 获取每一帧
    ret, frame = capture.read()
    # 9 显示提示信息:调用方法
    show_info(frame, tracking_state)
    # 10 如果获取到的坐标点为2个,那么就绘制出矩形框,以及也要让dlib的rectangle()知道坐标点在哪里
    if len(points) == 2 :
        cv2.rectangle(frame, points[0], points[1], (0,255,0), 3) # points[0] : (x,y), points[1] : (x,y)
        dlib_rect = dlib.rectangle(points[0][0], points[0][1], points[1][0], points[1][1])
    # 11 判断:如果跟踪状态为True, 那么,更新跟踪,获取位置,绘制矩形框
    if tracking_state is True:
        tracker.update(frame) # 更新画面
        pos = tracker.get_position() # 获取位置的坐标
        cv2.rectangle(frame, (int(pos.left()),int(pos.top())), (int(pos.right()), int(pos.bottom())), (255, 0, 0), 3)

    # 12 事件判断,根据按键:'1', '2', 'q'
    key = cv2.waitKey(1) & 0xFF

    if key == ord('1'):
        if len(points) == 2:
            tracker.start_track(frame, dlib_rect)
            tracking_state = True
            points = []

    if key == ord('2'):
        points = []
        tracking_state = False

    if key == ord('q'):
        break

    # 13 显示整体效果
    cv2.imshow(nameWindow, frame)

capture.release()
cv2.destroyAllWindows()