目录
案例:k-means对Instacart Market用户聚类
线性回归
目标值:连续型的数据
应用场景
- 房价预测
- 销售额度预测
- 金融:贷款额度预测、利用线性回归以及系数分析因子
what?
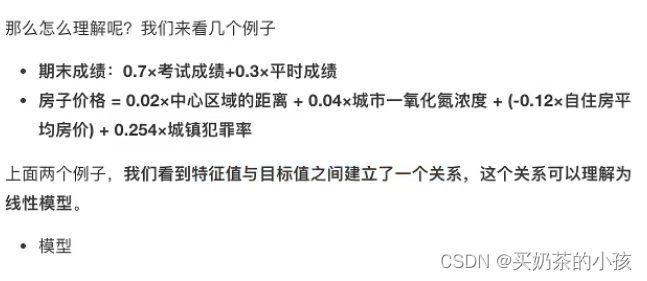
特征值和目标值之间是一种函数关系
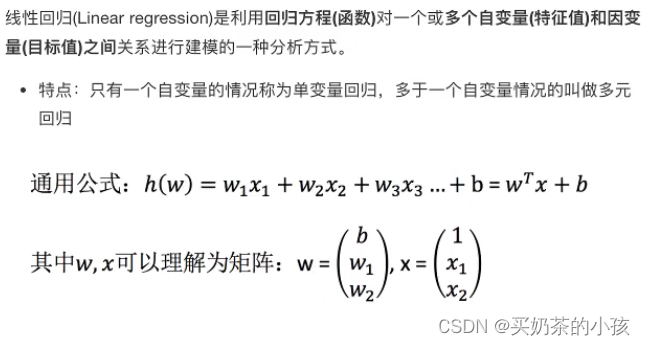
?
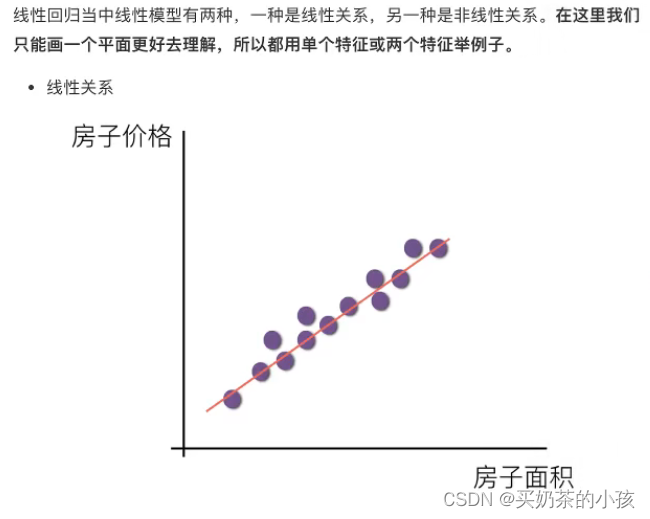
线性关系
符合y = kx + b
有两个特征 y = w1x1 + w2x2 + b
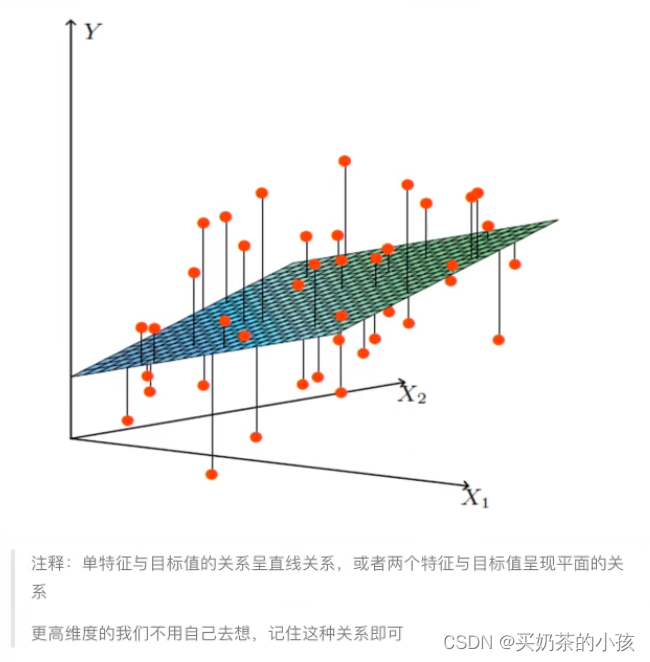 ?
? ?
?
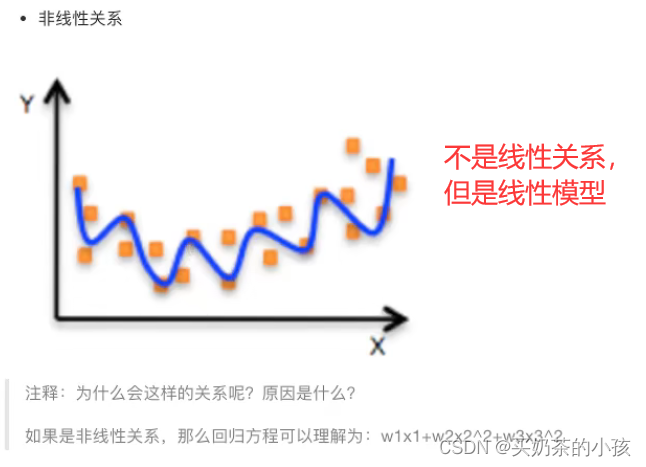
线性模型
自变量x一次
y = w1x1 + w2x2 + w3x3 + ... + wnxn + b
参数一次
y = w1x1 + w2x1^2 + w3x1^3 + w4x2^3 + ... + b
线性关系一定是线性模型
线性模型不一定是线性关系
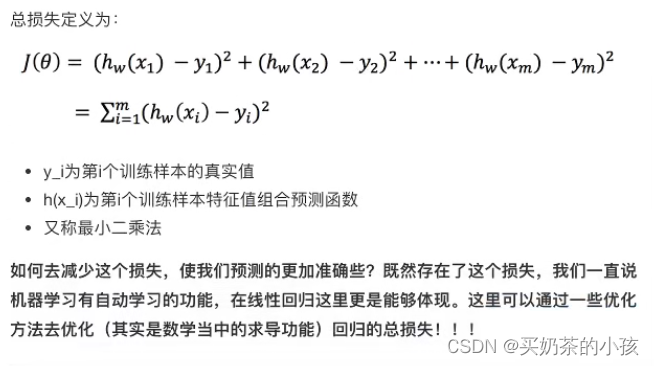
线性回归的损失和优化原理
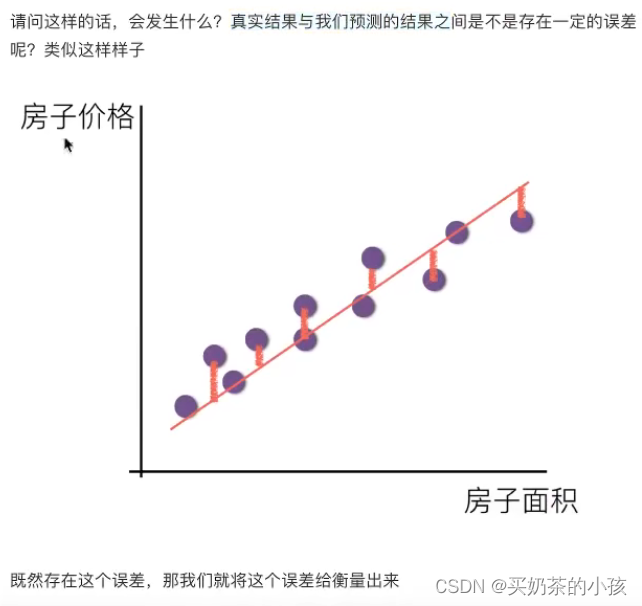
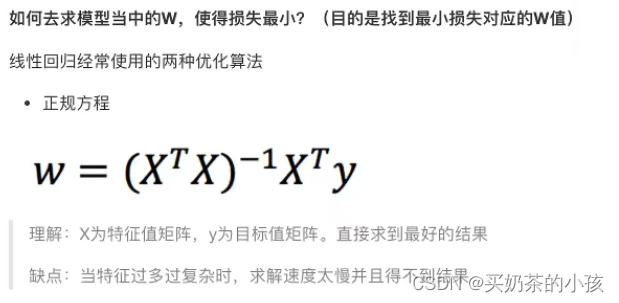
目标:求模型参数(模型参数能够使得预测准确)
真实关系:真实房子价格 = 0.02*中心区域的距离 + 0.04*城市一氧化氮浓度 + (-0.12*自住房平均房价)+ 0.254*城镇犯罪率
随意假定:预测房子价格 = 0.25*中心区域的距离 + 0.14*城市一氧化氮浓度 + 0.42*自住房平均房价 + 0.34*城镇犯罪率
损失函数
优化算法
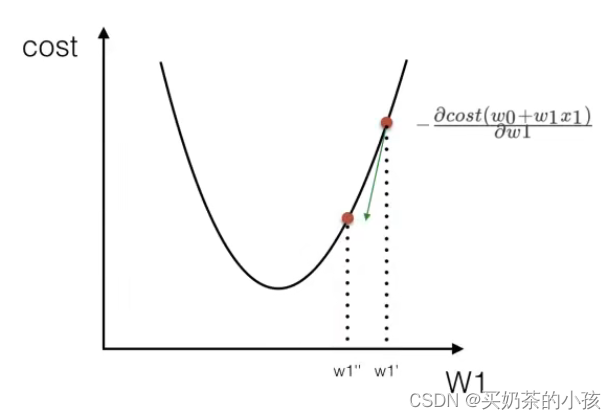
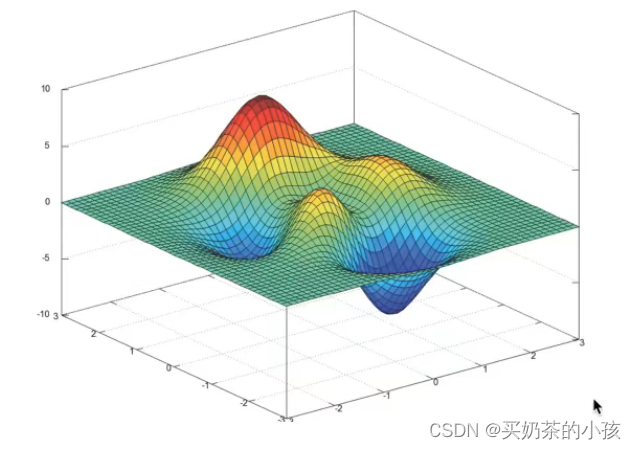
梯度下降
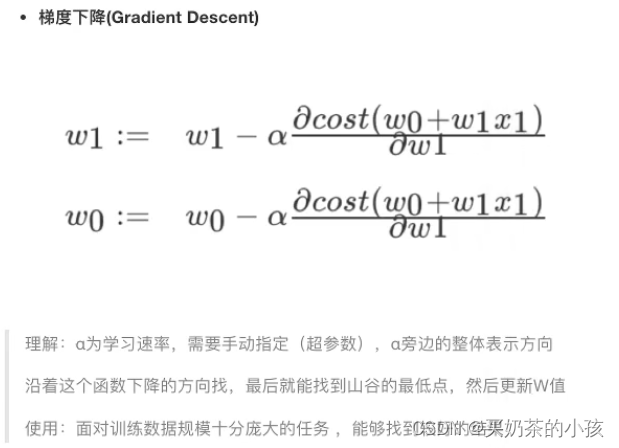
?
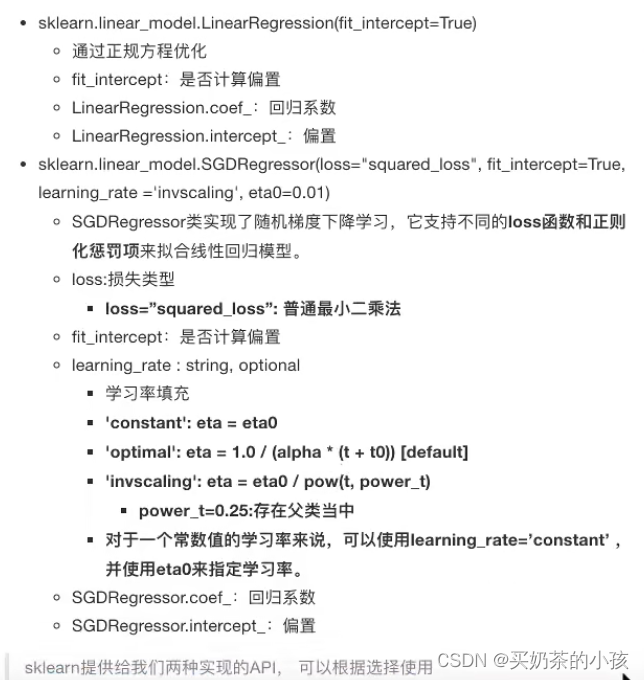
线性回归API
?
案例:波士顿房价预测?
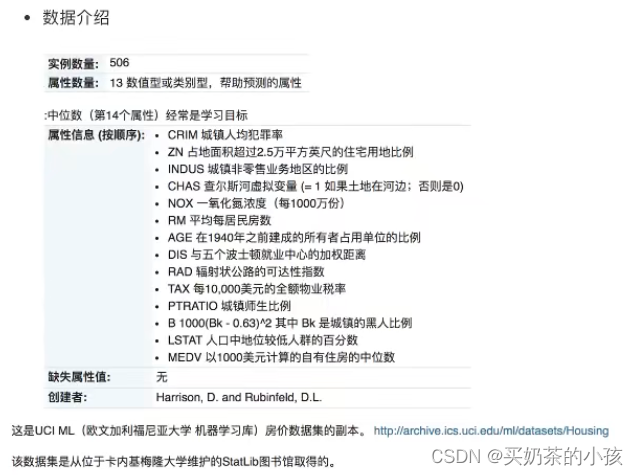
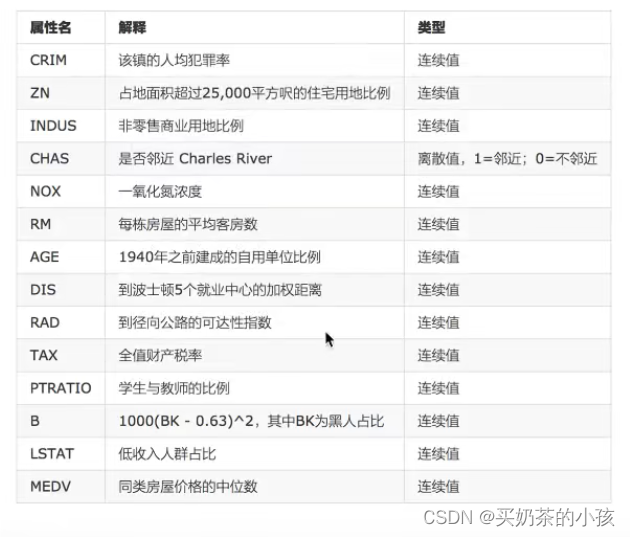
流程
- 获取数据集
- 划分数据集
- 特征工程:无量纲化 -- 标准化
- 预估器流程:fit()--> 模型,coef_intercept_
- 模型评估
from sklearn.datasets import load_boston
from sklearn.model_selection import train_test_split
from sklearn.preprocessing import StandardScaler
from sklearn.linear_model import LinearRegression, SGDRegressor
# 正规方程的优化方法对波士顿房价进行预测
def  linear_demo():
    # 1.获取数据
    boston = load_boston()
    # 2.划分数据集
    x_train, x_test, y_train, y_test = train_test_split(boston.data, boston.target, random_state=22)
    # 3.特征工程:标准化
    transfer = StandardScaler()
    x_train = transfer.fit_transform(x_train)
    x_test = transfer.transform(x_test)
    # 4.预估器
    estimator = LinearRegression()
    estimator.fit(x_train, y_train)
    # 5.得出模型
    print("权重系数为:\n", estimator.coef_)
    print("偏置为:\n", estimator.intercept_)
    # 6.模型评估

# 梯度下降的优化方法对波士顿房价进行预测
def linear_demo2():
    # 1.获取数据
    boston = load_boston()
    print("特征数量:\n", boston.data.shape)
    # 2.划分数据集
    x_train, x_test, y_train, y_test = train_test_split(boston.data, boston.target, random_state=22)
    # 3.特征工程:标准化
    transfer = StandardScaler()
    x_train = transfer.fit_transform(x_train)
    x_test = transfer.transform(x_test)
    # 4.预估器
    estimator = SGDRegressor()
    estimator.fit(x_train, y_train)
    # 5.得出模型
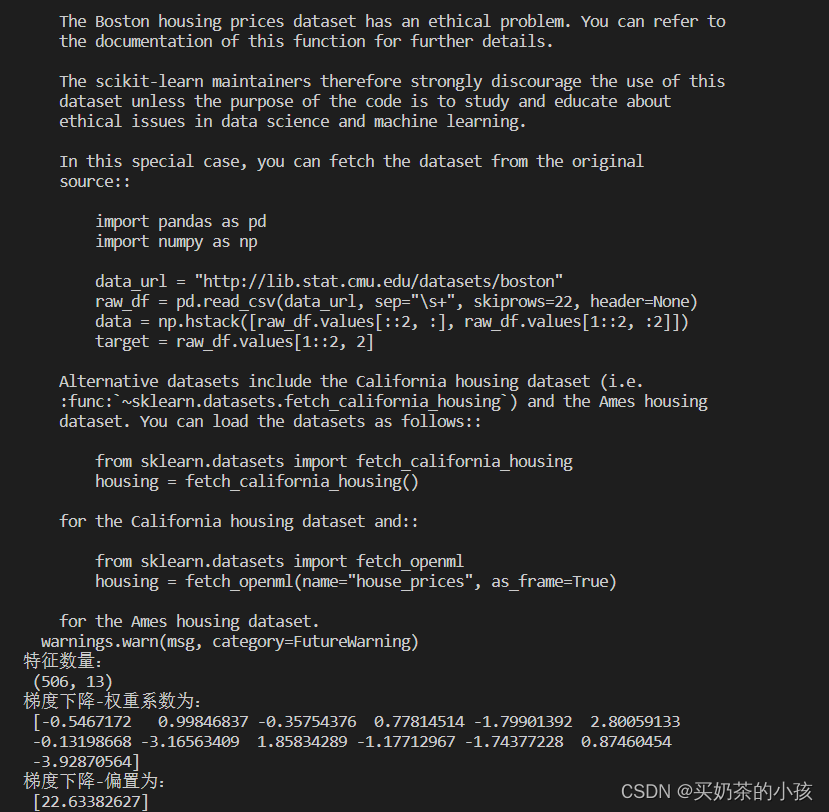
    print("梯度下降-权重系数为:\n", estimator.coef_)
    print("梯度下降-偏置为:\n", estimator.intercept_)
    # 6.模型评估

if __name__ == "__main__":
    linear_demo()
    linear_demo2()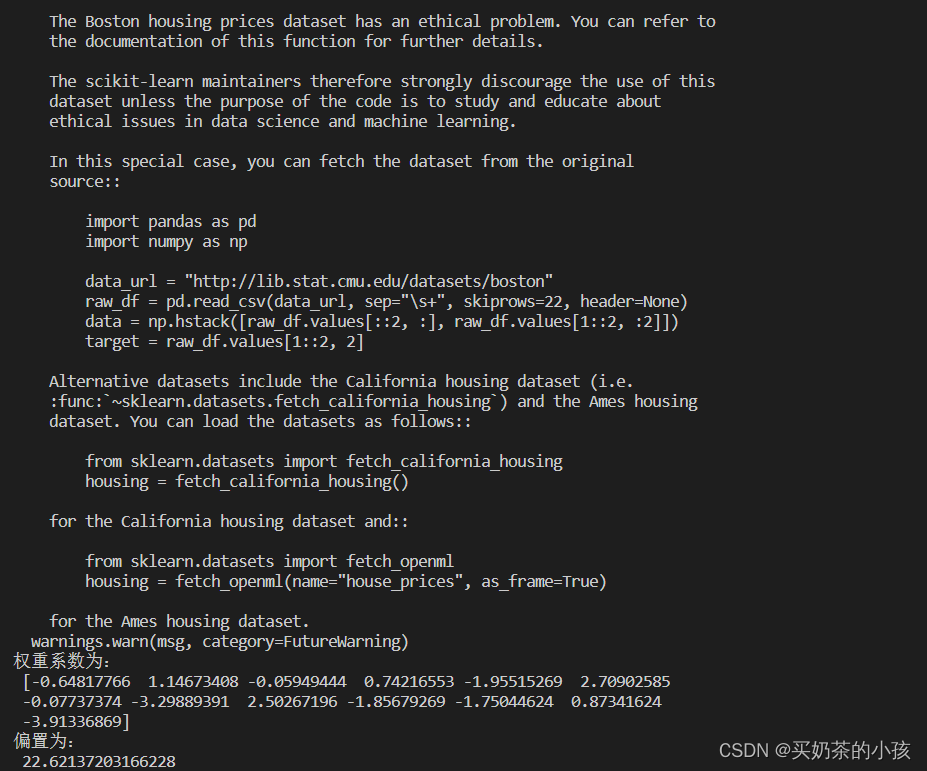
回归性能评估
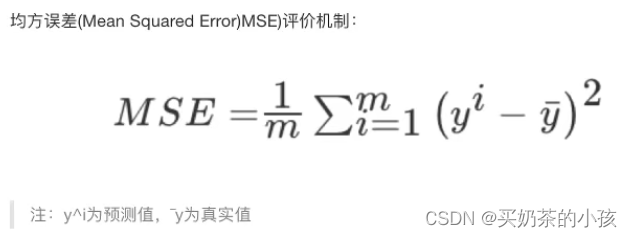
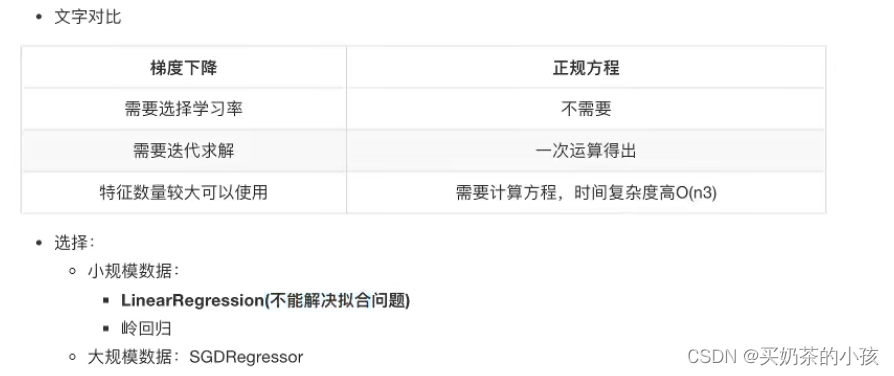
API

from sklearn.datasets import load_boston
from sklearn.model_selection import train_test_split
from sklearn.preprocessing import StandardScaler
from sklearn.linear_model import LinearRegression, SGDRegressor
from sklearn.metrics import mean_squared_error
# 正规方程的优化方法对波士顿房价进行预测
def  linear_demo():
    # 1.获取数据
    boston = load_boston()
    # 2.划分数据集
    x_train, x_test, y_train, y_test = train_test_split(boston.data, boston.target, random_state=22)
    # 3.特征工程:标准化
    transfer = StandardScaler()
    x_train = transfer.fit_transform(x_train)
    x_test = transfer.transform(x_test)
    # 4.预估器
    estimator = LinearRegression()
    estimator.fit(x_train, y_train)
    # 5.得出模型
    print("权重系数为:\n", estimator.coef_)
    print("偏置为:\n", estimator.intercept_)
    # 6.模型评估
    y_predict = estimator.predict(x_test)
    print("预测房价:\n", y_predict)
    error = mean_squared_error(y_test, y_predict)
    print("正规方程-均方误差为:\n", error)

# 梯度下降的优化方法对波士顿房价进行预测
def linear_demo2():
    # 1.获取数据
    boston = load_boston()
    print("特征数量:\n", boston.data.shape)
    # 2.划分数据集
    x_train, x_test, y_train, y_test = train_test_split(boston.data, boston.target, random_state=22)
    # 3.特征工程:标准化
    transfer = StandardScaler()
    x_train = transfer.fit_transform(x_train)
    x_test = transfer.transform(x_test)
    # 4.预估器
    estimator = SGDRegressor(learning_rate="constant", eta0=0.01, max_iter=10000)
    estimator.fit(x_train, y_train)
    # 5.得出模型
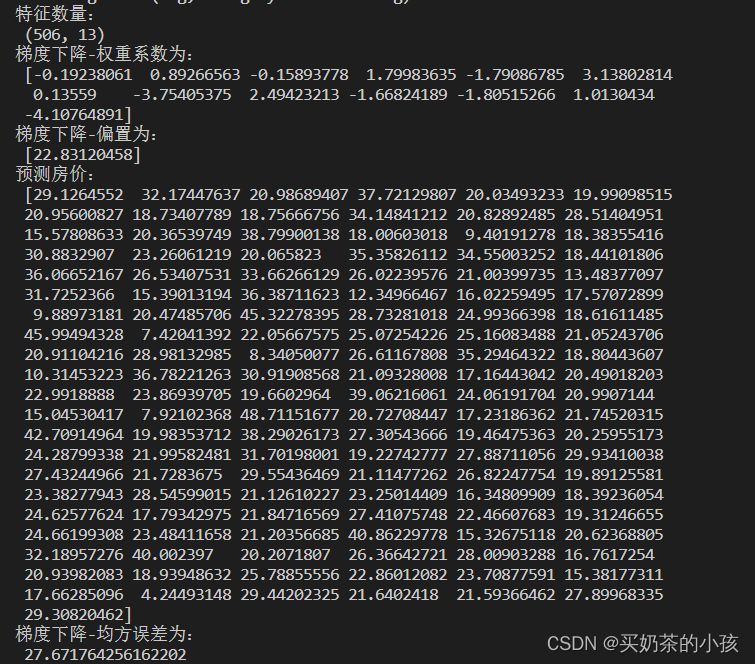
    print("梯度下降-权重系数为:\n", estimator.coef_)
    print("梯度下降-偏置为:\n", estimator.intercept_)
    # 6.模型评估
    y_predict = estimator.predict(x_test)
    print("预测房价:\n", y_predict)
    error = mean_squared_error(y_test, y_predict)
    print("梯度下降-均方误差为:\n", error)

if __name__ == "__main__":
    linear_demo()
    linear_demo2()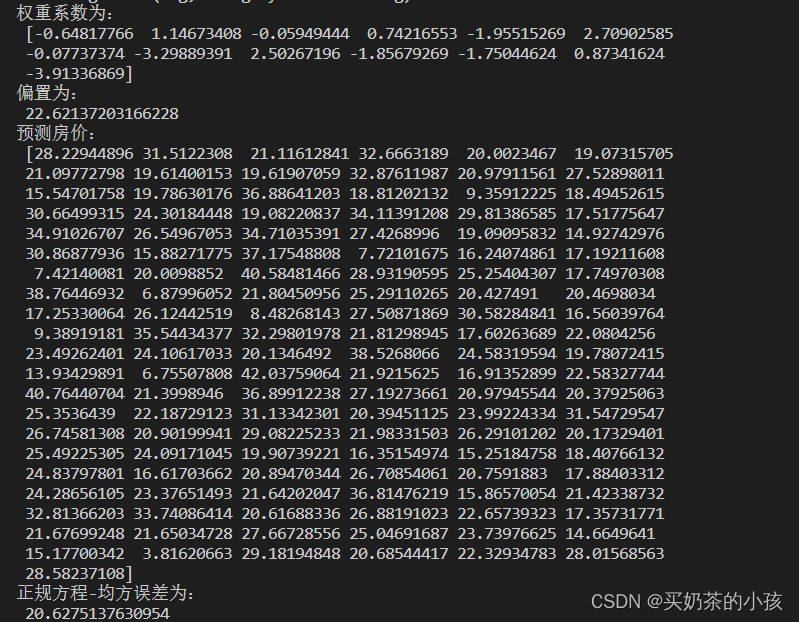
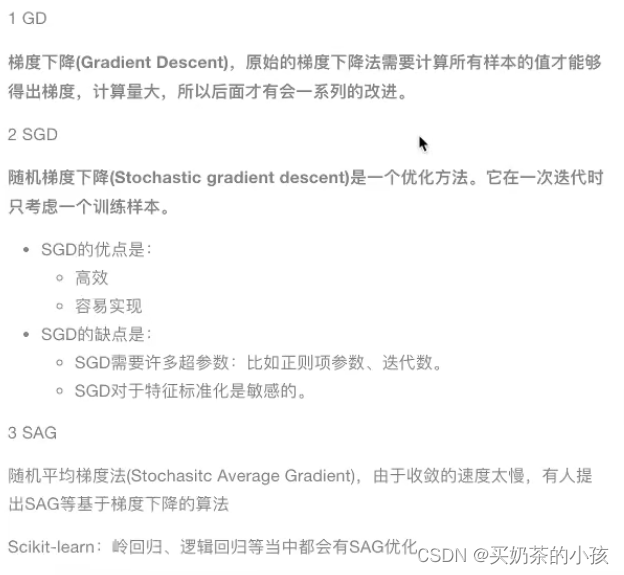
拓展—关于优化方法GD、SGD、SAG
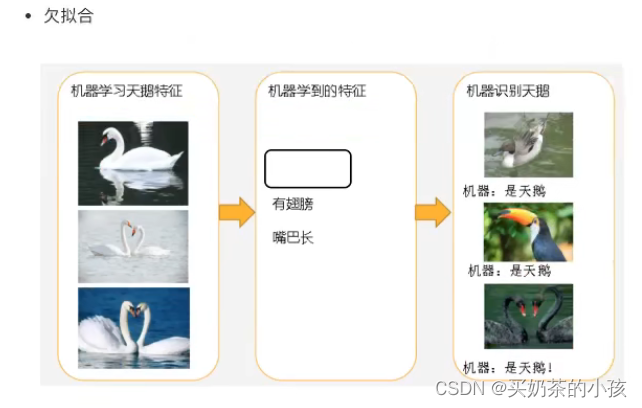
欠拟合与过拟合
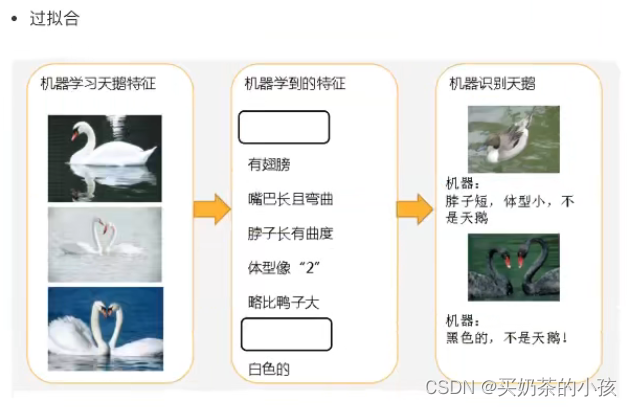
在测试集上表现的很好,测试集上不太好——过拟合现象
欠拟合:特征太少
过拟合:特征太多
?
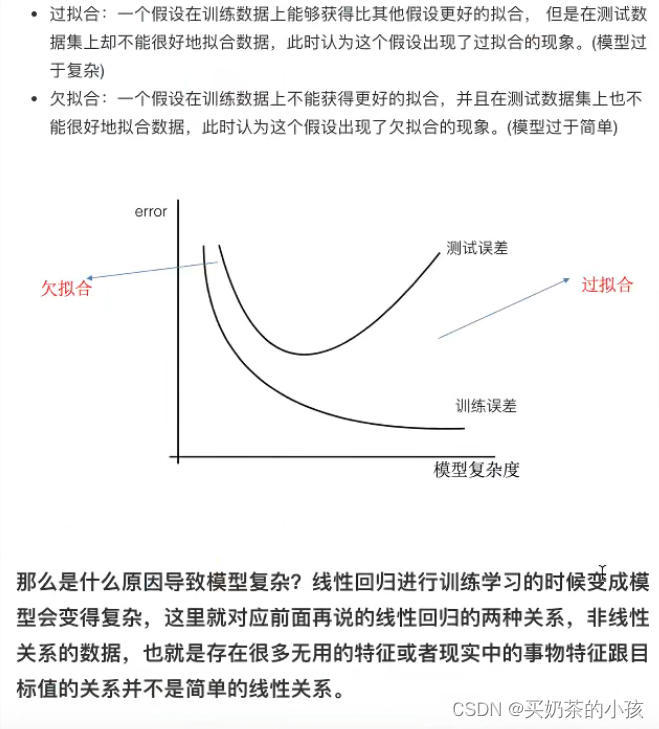
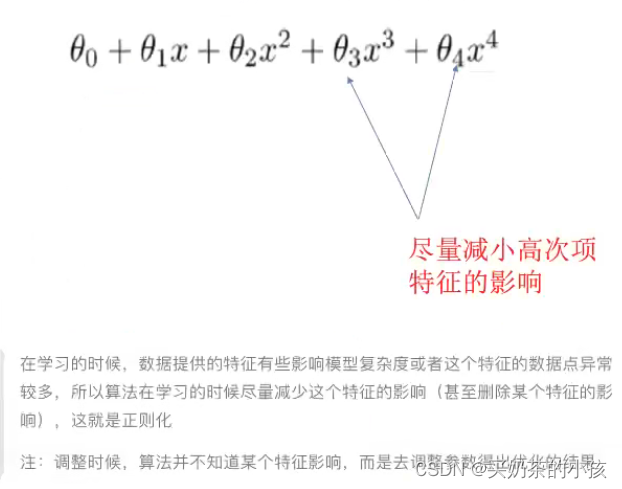
原因以及解决办法
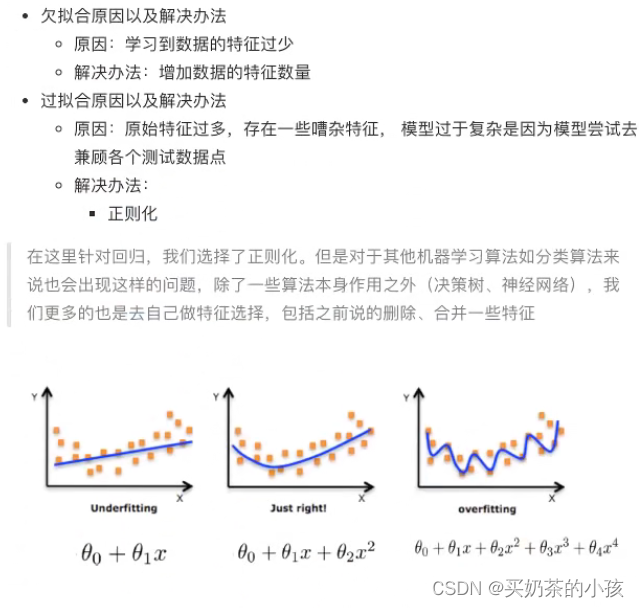
?
正则化类别
L1正则化
????????损失函数 + λ惩罚项(w绝对值加在一起)
L2正则化更常用
????????损失函数 + λ惩罚项(使w变小)
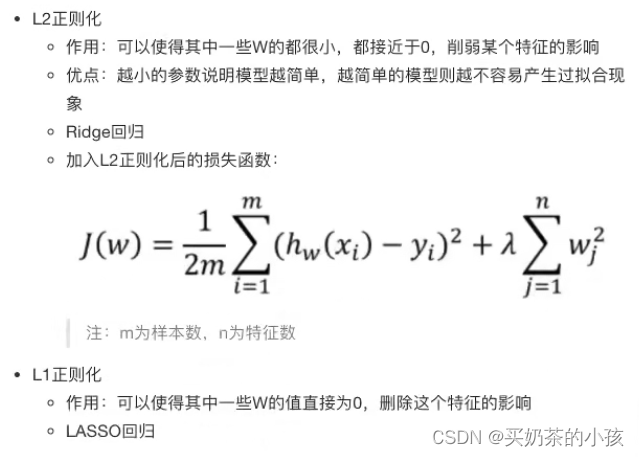
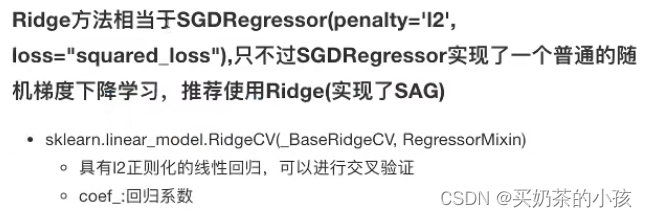
带有L2正则化的线性回归—岭回归
岭回归,其实也是一种线性回归。只不过在算法建立回归方程的时候,加上正则化的限制,从而达到解决过拟合的效果
API
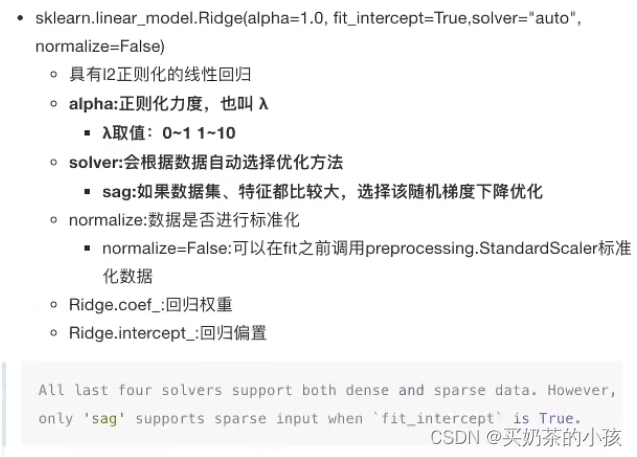
波士顿房价三种方法汇总?
from sklearn.datasets import load_boston
from sklearn.model_selection import train_test_split
from sklearn.preprocessing import StandardScaler
from sklearn.linear_model import LinearRegression, Ridge, SGDRegressor
from sklearn.metrics import mean_squared_error
# 正规方程的优化方法对波士顿房价进行预测
def  linear_demo():
    # 1.获取数据
    boston = load_boston()
    # 2.划分数据集
    x_train, x_test, y_train, y_test = train_test_split(boston.data, boston.target, random_state=22)
    # 3.特征工程:标准化
    transfer = StandardScaler()
    x_train = transfer.fit_transform(x_train)
    x_test = transfer.transform(x_test)
    # 4.预估器
    estimator = LinearRegression()
    estimator.fit(x_train, y_train)
    # 5.得出模型
    print("权重系数为:\n", estimator.coef_)
    print("偏置为:\n", estimator.intercept_)
    # 6.模型评估
    y_predict = estimator.predict(x_test)
    print("预测房价:\n", y_predict)
    error = mean_squared_error(y_test, y_predict)
    print("正规方程-均方误差为:\n", error)

# 梯度下降的优化方法对波士顿房价进行预测
def linear_demo2():
    # 1.获取数据
    boston = load_boston()
    print("特征数量:\n", boston.data.shape)
    # 2.划分数据集
    x_train, x_test, y_train, y_test = train_test_split(boston.data, boston.target, random_state=22)
    # 3.特征工程:标准化
    transfer = StandardScaler()
    x_train = transfer.fit_transform(x_train)
    x_test = transfer.transform(x_test)
    # 4.预估器
    # estimator = SGDRegressor(learning_rate="constant", eta0=0.01, max_iter=10000) 默认是l2
    estimator = SGDRegressor(learning_rate="constant", eta0=0.01, max_iter=10000, penalty="l1")
    estimator.fit(x_train, y_train)
    # 5.得出模型
    print("梯度下降-权重系数为:\n", estimator.coef_)
    print("梯度下降-偏置为:\n", estimator.intercept_)
    # 6.模型评估
    y_predict = estimator.predict(x_test)
    print("预测房价:\n", y_predict)
    error = mean_squared_error(y_test, y_predict)
    print("梯度下降-均方误差为:\n", error)

# 岭回归对波士顿房价进行预测
def linear_demo3():
    # 1.获取数据
    boston = load_boston()
    # 2.划分数据集
    x_train, x_test, y_train, y_test = train_test_split(boston.data, boston.target, random_state=22)
    # 3.标准化
    transfer = StandardScaler()
    x_train = transfer.fit_transform(x_train)
    x_test = transfer.transform(x_test)
    # 4.预估器
    # estimator = Ridge()
    estimator = Ridge(alpha=0.5, max_iter=10000)
    estimator.fit(x_train, y_train)
    # 5.得出模型
    print("岭回归-权重系数为:\n", estimator.coef_)
    print("岭回归-偏置为:\n", estimator.intercept_)
    # 6.模型评估
    y_predict = estimator.predict(x_test)
    print("预测房价:\n", y_predict)
    error = mean_squared_error(y_test, y_predict)
    print("岭回归-均方误差为:\n",error)

if __name__ == "__main__":
    linear_demo()
    linear_demo2()
    linear_demo3()
分类算法—逻辑回归与二分类
逻辑回归的应用场景
- 广告点击率
- 是否为垃圾邮件
- 是否患病
- 金融诈骗
- 虚假账号
特点:属于/不属于?
逻辑回归的原理
输入
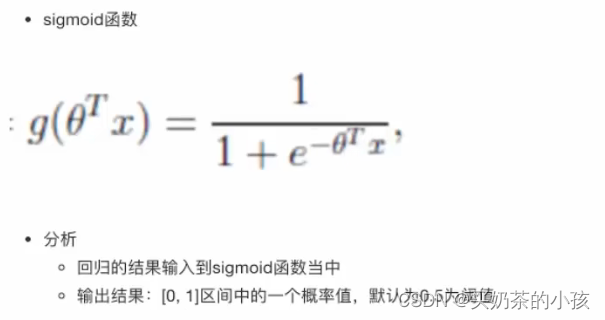
h(w)= w1x1 + w2x2 + w3x3 +...+ b
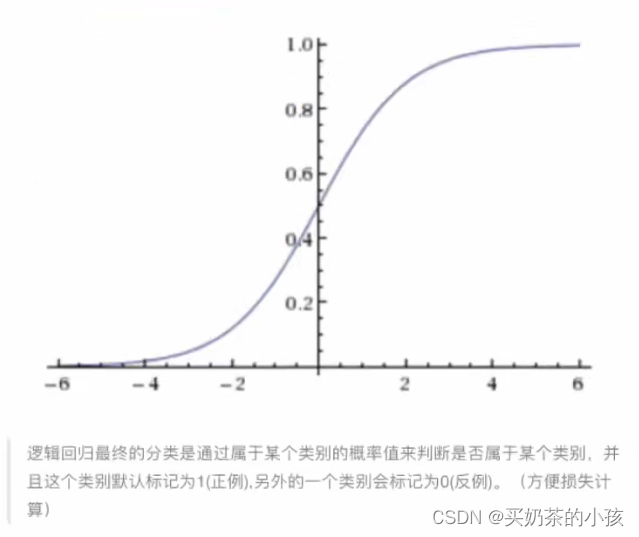
逻辑回归的输入就是一个线性回归的结果(线性回归的输出就是逻辑回归的输入)
激活函数
?
损失函数
(y_predict - y_true)平方和/总数
逻辑回归的真实值/预测值 是否属于某个类别
损失以及优化?
损失
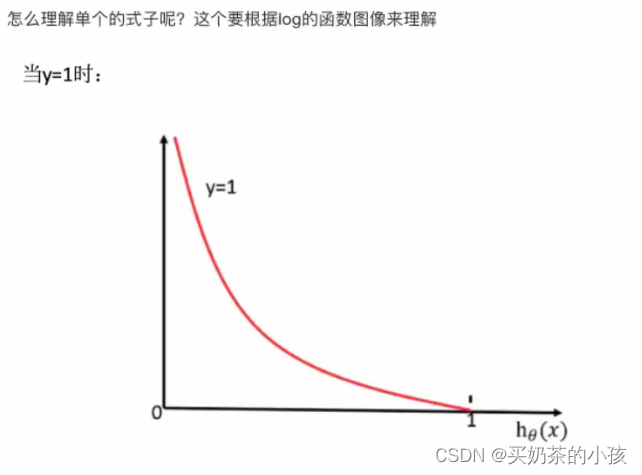
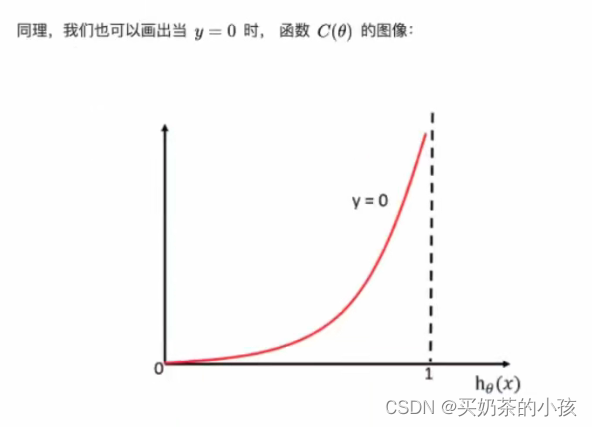
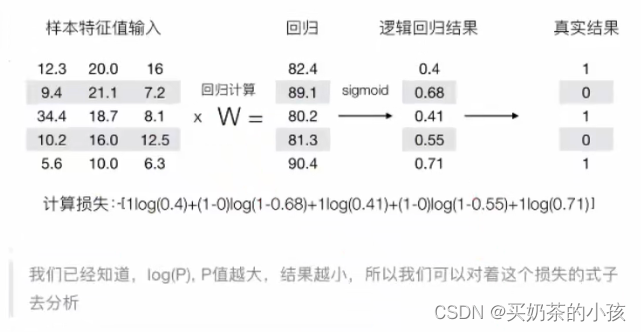
逻辑回归的损失,称之为对数似然损失

?

?
优化
梯度下降

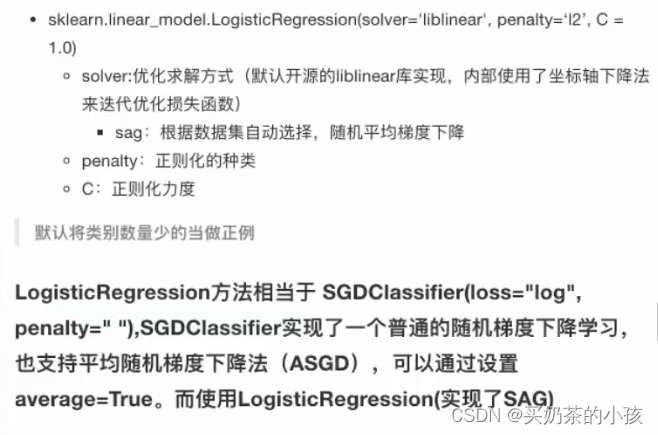
API
案例:癌症分类预测-良/恶性乳腺癌肿瘤预测
流程分析
- 获取数据:读取的时候加上names
- 数据处理:处理缺失值
- 数据集划分
- 特征工程:无量纲化处理--标准化
- 逻辑回归预估器
- 模型评估
import pandas as pd
import numpy as np
from sklearn.model_selection import train_test_split
from sklearn.preprocessing import StandardScaler
from sklearn.linear_model import LogisticRegression

def  cancer_demo():
    # 1.获取数据
    path = "http..."
    column_name = ['Sample code number', 'Clump Thickness', 'Uniformity of Cell Shape', 'Marginal Adhesion', 'Single Epithelial Cell Size',
    'Bare Nuclei','Bland Chromatin', 'Normal Nucleoli', 'Mitoses', 'Class']
    data = pd.read_csv(path, names=column_name)
    # 2.缺失值处理
    # 1)替换-->np.nan
    data = data.replace(to_replace="?", value=np.nan)
    # 2)删除缺失样本
    data.dropna(inplace=True)
    # 3.划分数据集
    # 筛选特征值和目标值
    x = data.iloc[:, 1:-1]
    y = data["Class"]
    x_train, x_test, y_train, y_test = train_test_split(x, y)
    # 4.标准化
    transfer = StandardScaler()
    x_train = transfer.fit_transform(x_train)
    x_test = transfer.transform(x_test)
    # 5.预估器流程
    estimator = LogisticRegression()
    estimator.fit(x_train, y_train)
    # 逻辑回归的模型参数:回归系数和偏置
    estimator.coef_
    estimator.intercept_
    # 6.模型评估
    # 方法一:直接对比真实值和预测值
    y_predict = estimator.predict(x_test)
    print("y_predict:\n", y_predict)
    print("直接比对真实值和预测值:\n", y_test == y_predict)
    # 方法二:计算准确率
    score = estimator.score(x_test, y_test)
    print("准确率为:\n", score)


if __name__ == "__main__":
    cancer_demo()
分类的评估方法
精确率与召回率
混淆矩阵
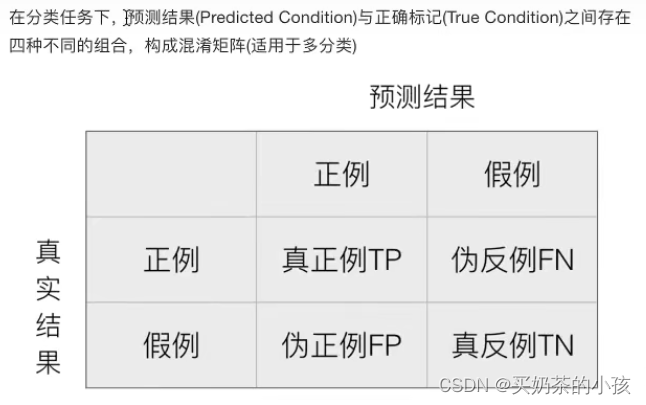
精确率:预测结果为正例样本中真实为正例的比例
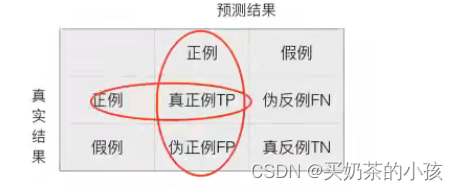
召回率:真实为正例的样本中预测结果为正例的比例 (看查的全不全,对正样本的区分能力)
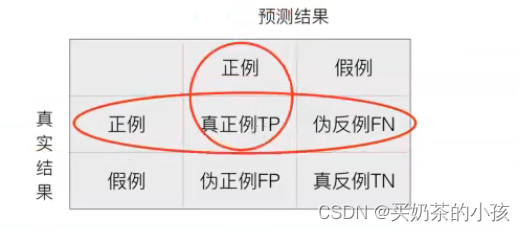
真正患癌症的,能够被检查出来的概率--召回率
F1-score 模型的稳健型
总共有100个人,如果有99个样本癌症,1个样本非癌症---样本不均衡
不管怎样全都预测正例(默认癌症为正例)---不负责任的模型
准确率:99%
召回率:99/99 = 100%
精确率:99%
F1-score:2*99% / 199% = 99.497%
AUC:0.5
????????TPR = 100%
????????FPR = 1 / 1 = 100%

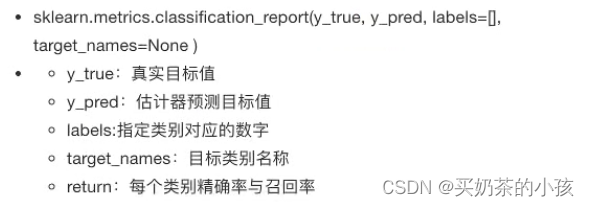
?分类评估报告API
import pandas as pd
import numpy as np
from sklearn.model_selection import train_test_split
from sklearn.preprocessing import StandardScaler
from sklearn.linear_model import LogisticRegression
from sklearn.metrics import classification_report

def  cancer_demo():
    # 1.获取数据
    path = "http..."
    column_name = ['Sample code number', 'Clump Thickness', 'Uniformity of Cell Shape', 'Marginal Adhesion', 'Single Epithelial Cell Size',
    'Bare Nuclei','Bland Chromatin', 'Normal Nucleoli', 'Mitoses', 'Class']
    data = pd.read_csv(path, names=column_name)
    # 2.缺失值处理
    # 1)替换-->np.nan
    data = data.replace(to_replace="?", value=np.nan)
    # 2)删除缺失样本
    data.dropna(inplace=True)
    # 3.划分数据集
    # 筛选特征值和目标值
    x = data.iloc[:, 1:-1]
    y = data["Class"]
    x_train, x_test, y_train, y_test = train_test_split(x, y)
    # 4.标准化
    transfer = StandardScaler()
    x_train = transfer.fit_transform(x_train)
    x_test = transfer.transform(x_test)
    # 5.预估器流程
    estimator = LogisticRegression()
    estimator.fit(x_train, y_train)
    # 逻辑回归的模型参数:回归系数和偏置
    estimator.coef_
    estimator.intercept_
    # 6.模型评估
    # 方法一:直接对比真实值和预测值
    y_predict = estimator.predict(x_test)
    print("y_predict:\n", y_predict)
    print("直接比对真实值和预测值:\n", y_test == y_predict)
    # 方法二:计算准确率
    score = estimator.score(x_test, y_test)
    print("准确率为:\n", score)
    # 查看精确率、召回率、F1-score
    report = classification_report(y_test, y_predict, labels=[2, 4], target_names=['良性', '恶性'])
    print(report)

if __name__ == "__main__":
    cancer_demo()
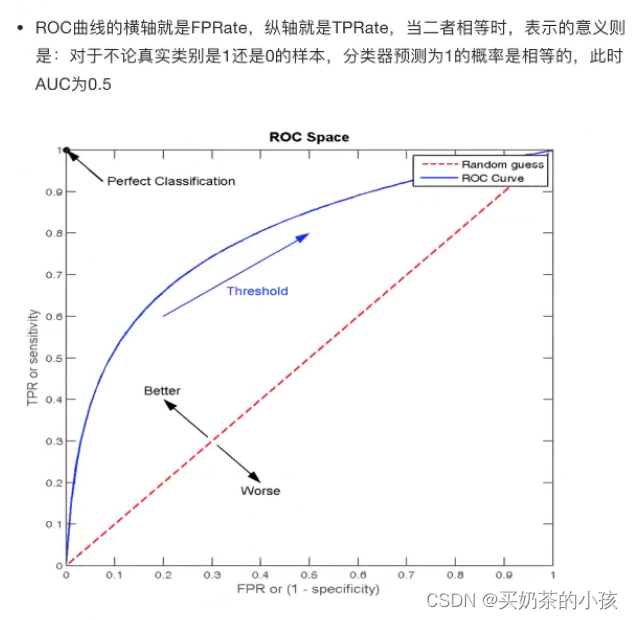
ROC曲线与AUC指标
TPR与FPR
TPR = TP / (TP + FN) --- 召回率
????????所有真实类别为1的样本中,预测类别为1的比例
FPR = FP / (FP + TN)
????????所有真实类别为0的样本中,预测类别为1的比例????????
ROC曲线?
AUC指标
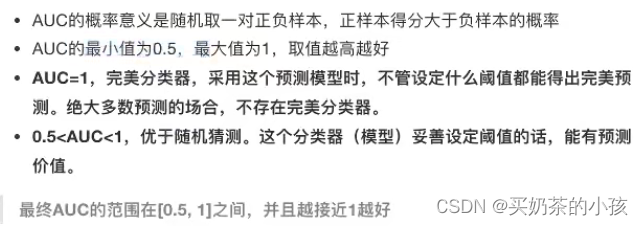
AUC计算API

- AUC只能用来评价二分类
- AUC非常适合评价样本不平衡中的分类器性能
import pandas as pd
import numpy as np
from sklearn.model_selection import train_test_split
from sklearn.preprocessing import StandardScaler
from sklearn.linear_model import LogisticRegression
from sklearn.metrics import classification_report
from sklearn.metrics import roc_auc_score

def  cancer_demo():
    # 1.获取数据
    path = "http..."
    column_name = ['Sample code number', 'Clump Thickness', 'Uniformity of Cell Shape', 'Marginal Adhesion', 'Single Epithelial Cell Size',
    'Bare Nuclei','Bland Chromatin', 'Normal Nucleoli', 'Mitoses', 'Class']
    data = pd.read_csv(path, names=column_name)
    # 2.缺失值处理
    # 1)替换-->np.nan
    data = data.replace(to_replace="?", value=np.nan)
    # 2)删除缺失样本
    data.dropna(inplace=True)
    # 3.划分数据集
    # 筛选特征值和目标值
    x = data.iloc[:, 1:-1]
    y = data["Class"]
    x_train, x_test, y_train, y_test = train_test_split(x, y)
    # 4.标准化
    transfer = StandardScaler()
    x_train = transfer.fit_transform(x_train)
    x_test = transfer.transform(x_test)
    # 5.预估器流程
    estimator = LogisticRegression()
    estimator.fit(x_train, y_train)
    # 逻辑回归的模型参数:回归系数和偏置
    estimator.coef_
    estimator.intercept_
    # 6.模型评估
    # 方法一:直接对比真实值和预测值
    y_predict = estimator.predict(x_test)
    print("y_predict:\n", y_predict)
    print("直接比对真实值和预测值:\n", y_test == y_predict)
    # 方法二:计算准确率
    score = estimator.score(x_test, y_test)
    print("准确率为:\n", score)
    # 查看精确率、召回率、F1-score
    report = classification_report(y_test, y_predict, labels=[2, 4], target_names=['良性', '恶性'])
    print(report)
    # y_true:每个样本的真实类别,必须为0(反例),1(正例)标记
    # 将y_test 转换成0 1
    y_true = np.where(y_test > 3, 1, 0)
    roc_auc_score(y_true, y_predict)

if __name__ == "__main__":
    cancer_demo()
模型保存和加载
sklearn模型的保存和加载API

import joblib
from sklearn.datasets import load_boston
from sklearn.model_selection import train_test_split
from sklearn.preprocessing import StandardScaler
from sklearn.linear_model import LinearRegression, Ridge, SGDRegressor
from sklearn.metrics import mean_squared_error

# 岭回归对波士顿房价进行预测
def linear_demo3():
    # 1.获取数据
    boston = load_boston()
    # 2.划分数据集
    x_train, x_test, y_train, y_test = train_test_split(boston.data, boston.target, random_state=22)
    # 3.标准化
    transfer = StandardScaler()
    x_train = transfer.fit_transform(x_train)
    x_test = transfer.transform(x_test)
    # 4.预估器
    # estimator = Ridge()
    # estimator = Ridge(alpha=0.5, max_iter=10000)
    # estimator.fit(x_train, y_train)
    # 保存模型
    # joblib.dump(estimator, "my_ridge.pkl")
    # 加载模型
    estimator = joblib.load("my_ridge.pkl")
    # 5.得出模型
    print("岭回归-权重系数为:\n", estimator.coef_)
    print("岭回归-偏置为:\n", estimator.intercept_)
    # 6.模型评估
    y_predict = estimator.predict(x_test)
    print("预测房价:\n", y_predict)
    error = mean_squared_error(y_test, y_predict)
    print("岭回归-均方误差为:\n",error)

if __name__ == "__main__":
    linear_demo3()
无监督学习--K-means算法
无监督学习
没有目标值 -- 无监督学习


无监督学习包含算法
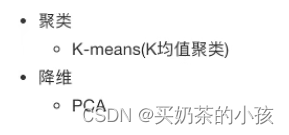
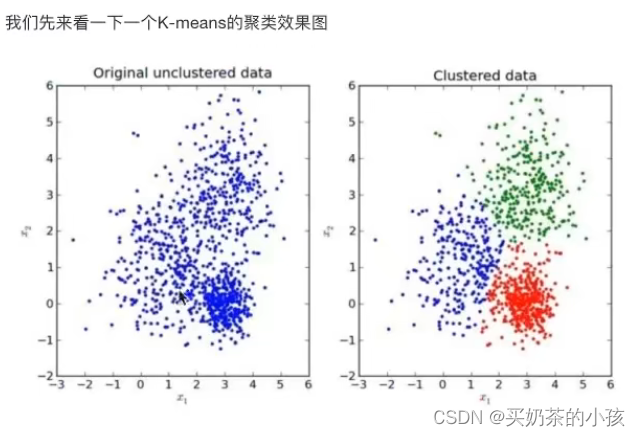
K-means原理
要几个特征就让k值等于几
?
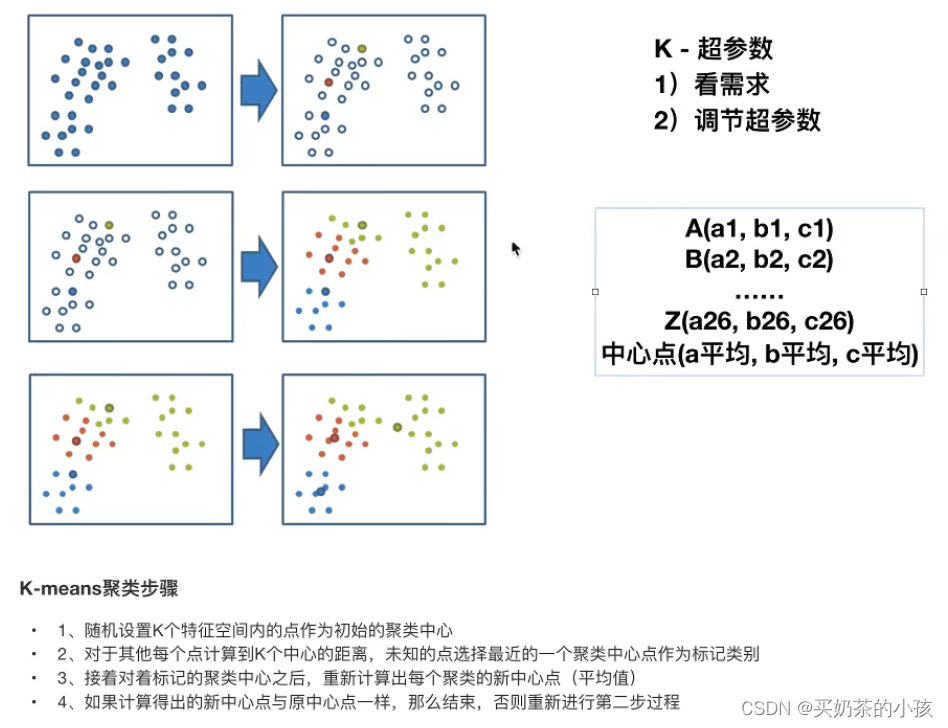
K-means API

案例:k-means对Instacart Market用户聚类
流程分析
降维之后的数据
- 预估器流程
- 看结果
- 模型评估
Kmeans性能评估指标
轮廓系数
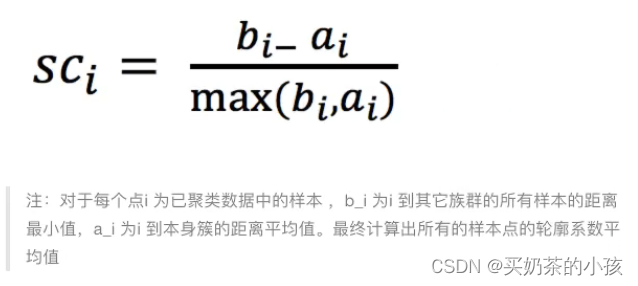
轮廓系数值分析?
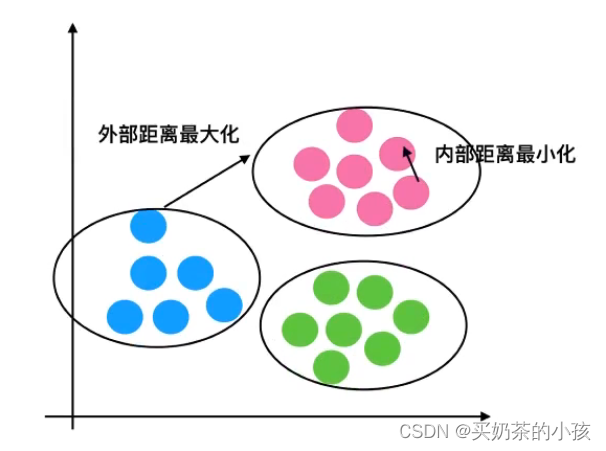
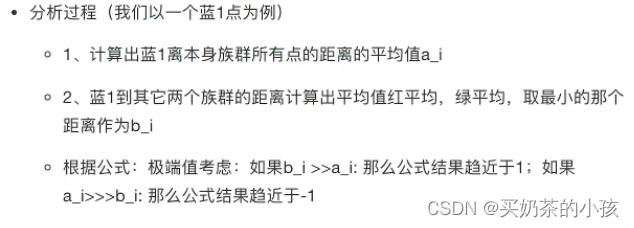
结论

?轮廓系数API

import pandas as pd
from sklearn.decomposition import PCA
from sklearn.cluster import KMeans
from sklearn.metrics import silhouette_score

def  linear_demo():
    # 1.获取数据
    order_products = pd.read_csv("F:/Python/order_products__prior.csv")
    products = pd.read_csv("F:/Python/products.csv")
    orders = pd.read_csv("F:/Python/orders.csv")
    aisles = pd.read_csv("F:/Python/aisles.csv")
    # 2.合并表
    table1 = pd.merge(order_products, products, on=["product_id","product_id"])
    table2 = pd.merge(table1, aisles, on=["aisle_id","aisle_id"])
    table = pd.merge(table2, orders, on=["order_id","order_id"])
    # 3.找到user_id和aisle之间的关系
    table = pd.crosstab(tab3["user_id"], tab3["aisle"])
    data = table[:10000]
    # 4.PCA降维
    # 1)实例化一个转换器类
    transfer = PCA(n_components=0.95)
    # 2)调用fit_transform
    data_new = transfer.fit_transform(data)
    # 预估器流程
    estimator = KMeans(n_clusters=3)
    estimator.fit(data_new)
    y_predict = estimator.predict(data_new)
    print(y_predict[:300])
    # 模型评估-轮廓系数
    score = silhouette_score(data_new, y_predict)
    print(score)

if __name__ == "__main__":
    linear_demo()
K-means总结
特点分析:采用迭代式算法,直观易懂并且非常实用
缺点:容易收敛到局部最优解(多次聚类)
注:聚类一般做在分类之前