回归算法
线性回归
- 求解线性回归方法
- 正规方程
- 梯度下降
- 迭代
API
-
sklearn.linear_model.LinearRegression
- 正规方程优化
fit_intercept是否计算偏置量,没有的化经过原点- 属性
coef_回归系数intercept_偏置量
-
sklearn.linear_model.SGDRegressor
- 使用随机梯度下降优化
- 参数
loss- 损失函数,默认=‘squared_error’,还有huber,epsilon_insensitive,squared_epsilon_insensitive
learning_rate- 学习率的算法,默认invscaling,
- constant η = η 0 \eta=\eta_0 η=η0?
- optimal η = 1.0 / ( α ? ( t + t 0 ) ) \eta = 1.0 / (\alpha * (t + t_0)) η=1.0/(α?(t+t0?))
- invscaling η = η 0 / t p o w e r t \eta = \eta_0 / t^{power_t} η=η0?/tpowert?
- adaptive
代码示例
波士顿房价预测
- LinearRegression
from sklearn.linear_model import LinearRegression
from sklearn.datasets import load_boston
from sklearn.preprocessing import StandardScaler
from sklearn.model_selection import train_test_split
import matplotlib.pyplot as plt

data = load_boston()

x_train,x_test,y_train,y_test = train_test_split(data.data,data.target)
transfer = StandardScaler()

#数据标准化
x_train=transfer.fit_transform(x_train)
x_test = transfer.transform(x_test)

reg = LinearRegression()
#使用LinearRegression
reg.fit(x_train,y_train)

print(reg.coef_,reg.intercept_)
y_predict = reg.predict(x_test)

print(y_test)
print(y_predict)

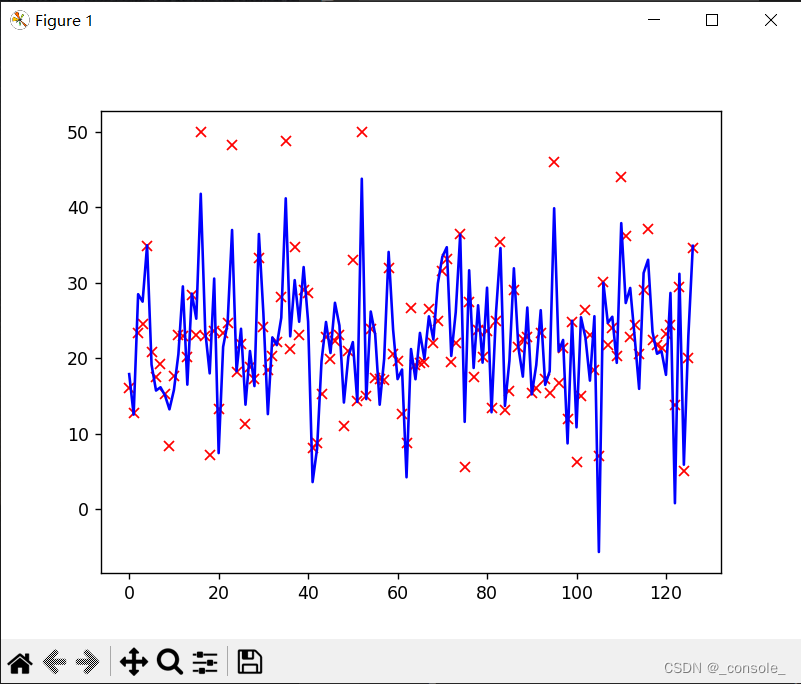
#绘图显示差异
x = list(range(len(y_test)))
plt.plot(x,y_test,'rx')
plt.plot(x,y_predict,'b-')
plt.show()

- SGDRegressor
from sklearn.linear_model import SGDRegressor
from sklearn.datasets import load_boston
from sklearn.preprocessing import StandardScaler
from sklearn.model_selection import train_test_split
import matplotlib.pyplot as plt

data = load_boston()

x_train,x_test,y_train,y_test = train_test_split(data.data,data.target)
transfer = StandardScaler()

#数据标准化
x_train=transfer.fit_transform(x_train)
x_test = transfer.transform(x_test)

reg = SGDRegressor()
#SGDRegressor
reg.fit(x_train,y_train)

print(reg.coef_,reg.intercept_)
y_predict = reg.predict(x_test)

print(y_test)
print(y_predict)

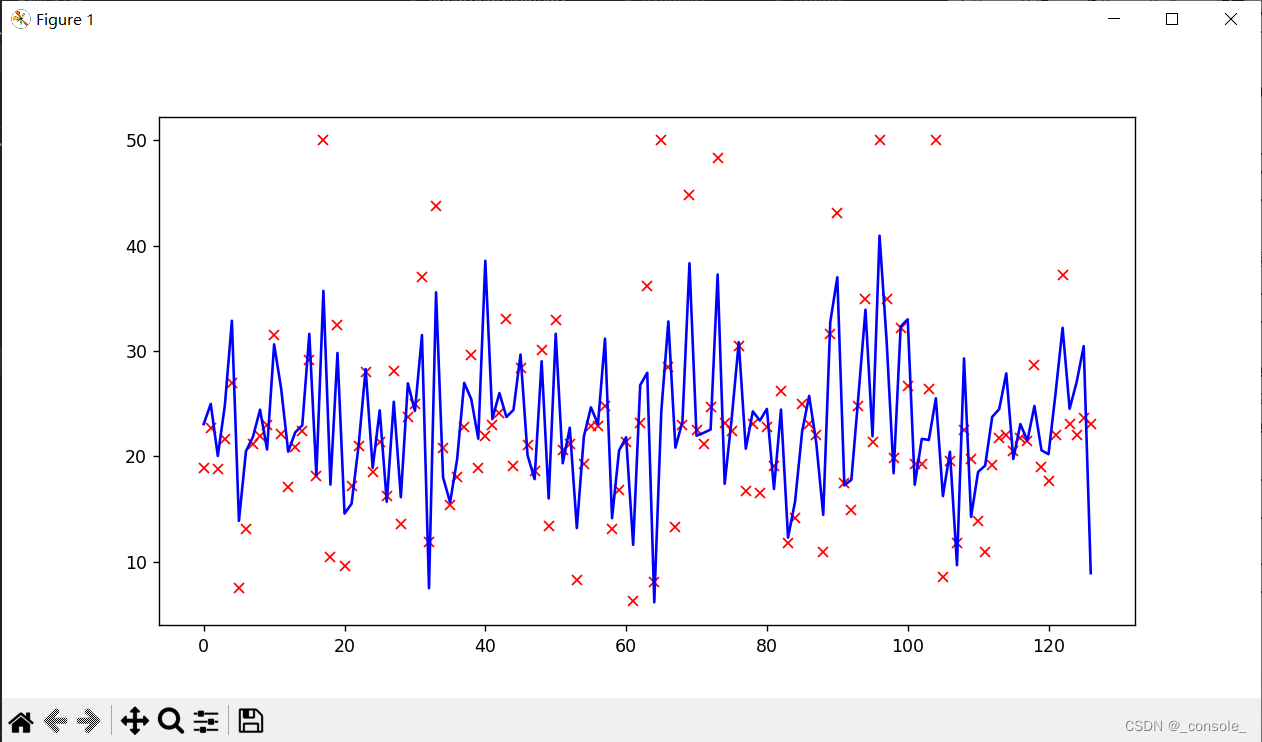
x = list(range(len(y_test)))
plt.plot(x,y_test,'rx')
plt.plot(x,y_predict,'b-')
plt.show()

回归模型评估
- 方法: 均方误差
- API
sklearn.metrics.mean_squared_error
mse = mean_squared_error(y_test,y_predict)
岭回归
实质上是一种改良的最小二乘估计法,通过放弃最小二乘法的无偏性,以损失部分信息、降低精度为代价获得回归系数更为符合实际、更可靠的回归方法,对病态数据的拟合要强于最小二乘法。
-
API
sklearn.linear_model.Ridge- 参数
- alpha: 正则化力度,取值 0-1,1-10
- solver:优化方法,默认auto
- auto, svd, cholesky, lsqr, sparse_cg, sag, saga, lbfgs
- normalize: 是否进行数据标准化
-
带有交叉验证的岭回归
from sklearn.linear_model import RidgeCV
代码示例
波士顿房价预测
from sklearn.linear_model import Ridge
from sklearn.datasets import load_boston
from sklearn.preprocessing import StandardScaler
from sklearn.model_selection import train_test_split
from sklearn.metrics import mean_squared_error
import matplotlib.pyplot as plt
import pandas as pd
import numpy as np

data = load_boston()

x_train,x_test,y_train,y_test = train_test_split(data.data,data.target,random_state=0)
transfer = StandardScaler()

#数据标准化
x_train=transfer.fit_transform(x_train)
x_test = transfer.transform(x_test)

reg = Ridge(max_iter=10000,alpha=0.8)
#使用LinearRegression
reg.fit(x_train,y_train)

print(reg.coef_,reg.intercept_)
y_predict = reg.predict(x_test)

# print(y_test)
# print(y_predict)
mse = mean_squared_error(y_test,y_predict)
print('方差为:',mse)

x = list(range(len(y_test)))
plt.plot(x,y_test,'rx')
plt.plot(x,y_predict,'b-')
plt.show()
逻辑回归
-
逻辑回归是分类算法,准确来说是解决二分类
-
激活函数
- sigmoid函数
g ( x ) = 1 1 + e ? x g(x)=\frac{1}{1+e^{-x}} g(x)=1+e?x1?
函数图像如下

-
输出结果
- 大于0.5,输出1,小于0.5,输出0
-
损失函数
- 对数似然损失
c o s t ( h θ ( x ) , y ) = { ? l o g ( h θ ( x ) ) i f ? y = 1 ? l o g ( 1 ? h θ ( x ) ) i f ? y = 0 cost(h_\theta(x),y)=\left\{ \begin{matrix} -log(h_\theta(x)) & if\space y=1 \\ -log(1-h_\theta(x)) & if\space y=0 \end{matrix} \right. cost(hθ?(x),y)={?log(hθ?(x))?log(1?hθ?(x))?if?y=1if?y=0?
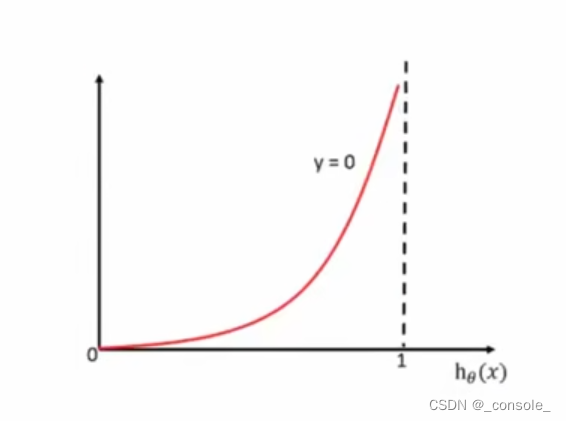
函数图像
- 对数似然损失
 y=1时,预测结果(横轴)越接近1,损失越小

y=0时,预测结果(横轴)越接近1,损失越大
- 损失函数
c o s t ( h θ ( x ) , y ) = ∑ i = 1 m ( ? y i l o g ( h θ ( x ) ) ? ( 1 ? y i ) l o g ( 1 ? h θ ( x ) ) ) cost(h_\theta(x),y)=\sum^m_{i=1}(-y_ilog(h_\theta(x))-(1-y_i)log(1-h_\theta(x))) cost(hθ?(x),y)=i=1∑m?(?yi?log(hθ?(x))?(1?yi?)log(1?hθ?(x)))