使用prometheus监控zookeeper集群
1、踩过的坑
1.1、部署docker监控其中一个节点
[root@gtcq-gtmed-wm-public-02 local]# docker run -it -p 9141:9141 --name=zookeeper_exporter_m -d -v /etc/localtime:/etc/localtime carlpett/zookeeper_exporter -zookeeper 10.153.23.2:2181
依次部署其它节点后发现zk_up是0
1.2、查询docker日志
[root@gtcq-gtmed-wm-public-01 prometheus-2.26]# docker logs 1b5f70879e99
time="2021-07-15T07:23:34Z" level=info msg="Fetching metrics from Zookeeper"
time="2021-07-15T07:23:34Z" level=warning msg="Unexpected format of returned data, expected tab-separated key/value." data="mntr is not executed because it is not in the whitelist."
此时发现日志的时间time="2021-07-15T07:23:34Z"有问题 在启动docker时添加 -v /etc/localtime:/etc/localtime解决,但是还是有问题
1.3、解决问题
最后在日志有“mntr is not executed because it is not in the whitelist” 反馈是mntr执行不了 ,经过查询zookeeper没有开启此功能,需要在配置文件中添加 ;
添加如下:
进入到zookeeper的zoo.cfg中,在zoo.cfg中添加如下一行代码并保存退出
#开启四字命令
4lw.commands.whitelist=*
然后我们进到zookeeper的bin目录进行重启zookeeper即可
2、部署zookeeper集群监控
2.1、在每个节点部署一个docker
[root@gtcq-gtmed-wm-public-02 local]# docker run -it -p 9141:9141 --name=zookeeper_exporter_m -d -v /etc/localtime:/etc/localtime carlpett/zookeeper_exporter -zookeeper 10.153.23.2:2181
这种集群有几个节点就需要几个Agent
在prometheus的配置文件 prometheus.yml
root@gtcq-gtmed-wm-public-01 prometheus-2.26]# more prometheus.yml

############PAAS-ZK监控########################
  - job_name: 'gt-hosp-zookeeper-exporter'
    static_configs:
    - targets: ['10.153.23.1:9141','10.153.23.2:9141','10.153.23.3:9141']
      labels:
        service: paas-zk
2.2、在一个节点部署一个Agent监控集群
docker run -it -p 9141:9141 --name=zookeeper_exporter_m -d -v /etc/localtime:/etc/localtime ghostbaby/zookeeper_exporter:v3.5.6 -listen 0.0.0.0:9141 -zk-list 10.153.23.1:2181,10.153.23.2:2181,10.153.23.3:2181
在prometheus的配置文件 prometheus.yml
 - job_name: 'gt-hosp-zookeeper-exporter'
    static_configs:
    - targets: ['XXXX:9141']
      labels:
        service: paas-zk
此处只添加一个
2.3、效果图
[root@gtcq-gtmed-wm-public-03 ~]# curl  127.0.0.1:9141/metrics
# HELP go_gc_duration_seconds A summary of the GC invocation durations.
# TYPE go_gc_duration_seconds summary
go_gc_duration_seconds{quantile="0"} 6.7057e-05
go_gc_duration_seconds{quantile="0.25"} 9.2096e-05
go_gc_duration_seconds{quantile="0.5"} 0.000105623
go_gc_duration_seconds{quantile="0.75"} 0.000125824
go_gc_duration_seconds{quantile="1"} 0.000380585
go_gc_duration_seconds_sum 0.036532949
go_gc_duration_seconds_count 288
# HELP go_goroutines Number of goroutines that currently exist.
# TYPE go_goroutines gauge
go_goroutines 12
# HELP go_memstats_alloc_bytes Number of bytes allocated and still in use.
# TYPE go_memstats_alloc_bytes gauge
go_memstats_alloc_bytes 1.795168e+06
# HELP go_memstats_alloc_bytes_total Total number of bytes allocated, even if freed.
# TYPE go_memstats_alloc_bytes_total counter
go_memstats_alloc_bytes_total 6.97810784e+08
# HELP go_memstats_buck_hash_sys_bytes Number of bytes used by the profiling bucket hash table.
# TYPE go_memstats_buck_hash_sys_bytes gauge
go_memstats_buck_hash_sys_bytes 1.464359e+06
# HELP go_memstats_frees_total Total number of frees.
# TYPE go_memstats_frees_total counter
go_memstats_frees_total 1.467254e+06
# HELP go_memstats_gc_sys_bytes Number of bytes used for garbage collection system metadata.
# TYPE go_memstats_gc_sys_bytes gauge
go_memstats_gc_sys_bytes 438272
# HELP go_memstats_heap_alloc_bytes Number of heap bytes allocated and still in use.
# TYPE go_memstats_heap_alloc_bytes gauge
go_memstats_heap_alloc_bytes 1.795168e+06
# HELP go_memstats_heap_idle_bytes Number of heap bytes waiting to be used.
# TYPE go_memstats_heap_idle_bytes gauge
go_memstats_heap_idle_bytes 3.03104e+06
# HELP go_memstats_heap_inuse_bytes Number of heap bytes that are in use.
# TYPE go_memstats_heap_inuse_bytes gauge
go_memstats_heap_inuse_bytes 2.932736e+06
# HELP go_memstats_heap_objects Number of allocated objects.
# TYPE go_memstats_heap_objects gauge
go_memstats_heap_objects 6680
# HELP go_memstats_heap_released_bytes_total Total number of heap bytes released to OS.
# TYPE go_memstats_heap_released_bytes_total counter
go_memstats_heap_released_bytes_total 606208
# HELP go_memstats_heap_sys_bytes Number of heap bytes obtained from system.
# TYPE go_memstats_heap_sys_bytes gauge
go_memstats_heap_sys_bytes 5.963776e+06
# HELP go_memstats_last_gc_time_seconds Number of seconds since 1970 of last garbage collection.
# TYPE go_memstats_last_gc_time_seconds gauge
go_memstats_last_gc_time_seconds 1.6263431599621556e+09
# HELP go_memstats_lookups_total Total number of pointer lookups.
# TYPE go_memstats_lookups_total counter
go_memstats_lookups_total 8087
# HELP go_memstats_mallocs_total Total number of mallocs.
# TYPE go_memstats_mallocs_total counter
go_memstats_mallocs_total 1.473934e+06
# HELP go_memstats_mcache_inuse_bytes Number of bytes in use by mcache structures.
# TYPE go_memstats_mcache_inuse_bytes gauge
go_memstats_mcache_inuse_bytes 13888
# HELP go_memstats_mcache_sys_bytes Number of bytes used for mcache structures obtained from system.
# TYPE go_memstats_mcache_sys_bytes gauge
go_memstats_mcache_sys_bytes 16384
# HELP go_memstats_mspan_inuse_bytes Number of bytes in use by mspan structures.
# TYPE go_memstats_mspan_inuse_bytes gauge
go_memstats_mspan_inuse_bytes 41344
# HELP go_memstats_mspan_sys_bytes Number of bytes used for mspan structures obtained from system.
# TYPE go_memstats_mspan_sys_bytes gauge
go_memstats_mspan_sys_bytes 49152
# HELP go_memstats_next_gc_bytes Number of heap bytes when next garbage collection will take place.
# TYPE go_memstats_next_gc_bytes gauge
go_memstats_next_gc_bytes 4.194304e+06
# HELP go_memstats_other_sys_bytes Number of bytes used for other system allocations.
# TYPE go_memstats_other_sys_bytes gauge
go_memstats_other_sys_bytes 1.806545e+06
# HELP go_memstats_stack_inuse_bytes Number of bytes in use by the stack allocator.
# TYPE go_memstats_stack_inuse_bytes gauge
go_memstats_stack_inuse_bytes 1.376256e+06
# HELP go_memstats_stack_sys_bytes Number of bytes obtained from system for stack allocator.
# TYPE go_memstats_stack_sys_bytes gauge
go_memstats_stack_sys_bytes 1.376256e+06
# HELP go_memstats_sys_bytes Number of bytes obtained by system. Sum of all system allocations.
# TYPE go_memstats_sys_bytes gauge
go_memstats_sys_bytes 1.1114744e+07
# HELP http_request_duration_microseconds The HTTP request latencies in microseconds.
# TYPE http_request_duration_microseconds summary
http_request_duration_microseconds{handler="prometheus",quantile="0.5"} 4134.222
http_request_duration_microseconds{handler="prometheus",quantile="0.9"} 4568.362
http_request_duration_microseconds{handler="prometheus",quantile="0.99"} 9090.156
http_request_duration_microseconds_sum{handler="prometheus"} 5.521397480000005e+06
http_request_duration_microseconds_count{handler="prometheus"} 662
# HELP http_request_size_bytes The HTTP request sizes in bytes.
# TYPE http_request_size_bytes summary
http_request_size_bytes{handler="prometheus",quantile="0.5"} 215
http_request_size_bytes{handler="prometheus",quantile="0.9"} 215
http_request_size_bytes{handler="prometheus",quantile="0.99"} 215
http_request_size_bytes_sum{handler="prometheus"} 142330
http_request_size_bytes_count{handler="prometheus"} 662
# HELP http_requests_total Total number of HTTP requests made.
# TYPE http_requests_total counter
http_requests_total{code="200",handler="prometheus",method="get"} 662
# HELP http_response_size_bytes The HTTP response sizes in bytes.
# TYPE http_response_size_bytes summary
http_response_size_bytes{handler="prometheus",quantile="0.5"} 2041
http_response_size_bytes{handler="prometheus",quantile="0.9"} 2046
http_response_size_bytes{handler="prometheus",quantile="0.99"} 2049
http_response_size_bytes_sum{handler="prometheus"} 1.187521e+06
http_response_size_bytes_count{handler="prometheus"} 662
# HELP process_cpu_seconds_total Total user and system CPU time spent in seconds.
# TYPE process_cpu_seconds_total counter
process_cpu_seconds_total 3.36
# HELP process_max_fds Maximum number of open file descriptors.
# TYPE process_max_fds gauge
process_max_fds 1.048576e+06
# HELP process_open_fds Number of open file descriptors.
# TYPE process_open_fds gauge
process_open_fds 9
# HELP process_resident_memory_bytes Resident memory size in bytes.
# TYPE process_resident_memory_bytes gauge
process_resident_memory_bytes 9.084928e+06
# HELP process_start_time_seconds Start time of the process since unix epoch in seconds.
# TYPE process_start_time_seconds gauge
process_start_time_seconds 1.62633299289e+09
# HELP process_virtual_memory_bytes Virtual memory size in bytes.
# TYPE process_virtual_memory_bytes gauge
process_virtual_memory_bytes 1.816576e+07
# HELP zk_approximate_data_size Approximate size of data set
# TYPE zk_approximate_data_size gauge
zk_approximate_data_size 182
# HELP zk_avg_latency Average latency of requests
# TYPE zk_avg_latency gauge
zk_avg_latency 0
# HELP zk_ephemerals_count Number of ephemeral nodes
# TYPE zk_ephemerals_count gauge
zk_ephemerals_count 0
# HELP zk_max_file_descriptor_count Maximum number of open file descriptors
# TYPE zk_max_file_descriptor_count counter
zk_max_file_descriptor_count 4096
# HELP zk_max_latency Maximum seen latency of requests
# TYPE zk_max_latency gauge
zk_max_latency 0
# HELP zk_min_latency Minimum seen latency of requests
# TYPE zk_min_latency gauge
zk_min_latency 0
# HELP zk_num_alive_connections Number of active connections
# TYPE zk_num_alive_connections gauge
zk_num_alive_connections 1
# HELP zk_open_file_descriptor_count Number of open file descriptors
# TYPE zk_open_file_descriptor_count gauge
zk_open_file_descriptor_count 80
# HELP zk_outstanding_requests Number of outstanding requests
# TYPE zk_outstanding_requests gauge
zk_outstanding_requests 0
# HELP zk_packets_received Number of packets received
# TYPE zk_packets_received counter
zk_packets_received 1
# HELP zk_packets_sent Number of packets sent
# TYPE zk_packets_sent counter
zk_packets_sent 1
# HELP zk_pending_syncs Number of followers with syncronizations pending
# TYPE zk_pending_syncs gauge
zk_pending_syncs 0
# HELP zk_server_state Server state (leader/follower)
# TYPE zk_server_state untyped
zk_server_state{state="leader"} 1
# HELP zk_synced_followers Number of followers in sync
# TYPE zk_synced_followers gauge
zk_synced_followers 2
# HELP zk_up Exporter successful
# TYPE zk_up gauge
zk_up 1
# HELP zk_watch_count Number of watches
# TYPE zk_watch_count gauge
zk_watch_count 0
# HELP zk_znode_count Number of znodes
# TYPE zk_znode_count gauge
zk_znode_count 5
# HELP zookeeper_exporter_build_info A metric with a constant '1' value labeled by version, revision, branch, and goversion from which zookeeper_exporter was built.
# TYPE zookeeper_exporter_build_info gauge
zookeeper_exporter_build_info{branch="master",goversion="go1.10.8",revision="0e30f3afdcb8e36be1b2a41fa432f4626012e5c0",version="v1.1.0"} 1
[root@gtcq-gtmed-wm-public-03 ~]#
3、ZK监控原理
![[外链图片转存失败,源站可能有防盗链机制,建议将图片保存下来直接上传(img-Tyt1j5Ow-1626347800458)(C:\Users\dell\AppData\Roaming\Typora\typora-user-images\image-20210715191150704.png)]](https://img-blog.csdnimg.cn/20210715192200845.png?x-oss-process=image/watermark,type_ZmFuZ3poZW5naGVpdGk,shadow_10,text_aHR0cHM6Ly9ibG9nLmNzZG4ubmV0L3FxXzMxNTU1OTUx,size_16,color_FFFFFF,t_70)
使用mntr获取数据转换成指标
4、PromQL监控语句
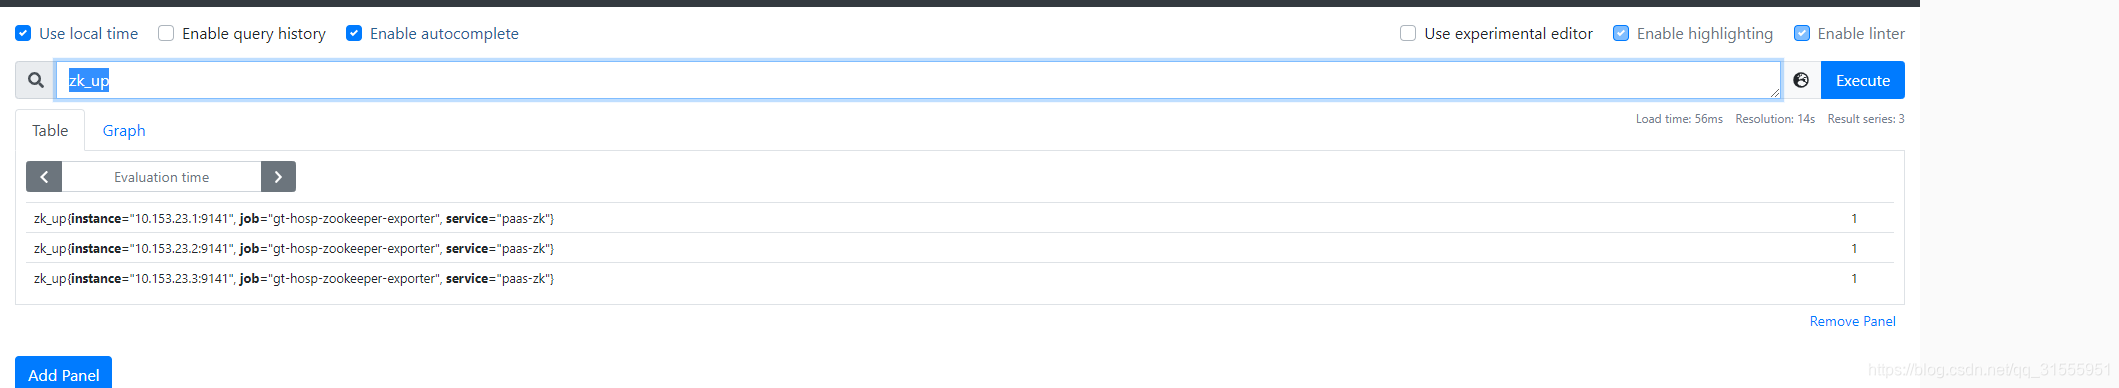
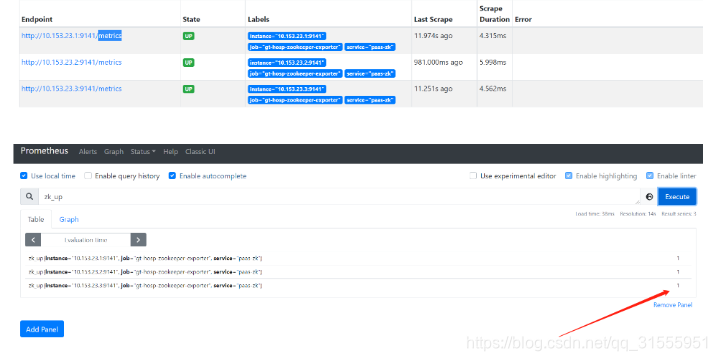
4.1、zookeeper服务器是否宕机
zk_up
说明:如果值为0就是宕机了,需要预警