MPAndroidChart
想要运用好本篇博客,读者至少需要掌握 Android 开发有关 Activity 的部分,并且对 MPAndroidChart 有简单的了解。本文是傻瓜式教程,更多需求请查看官方文档。
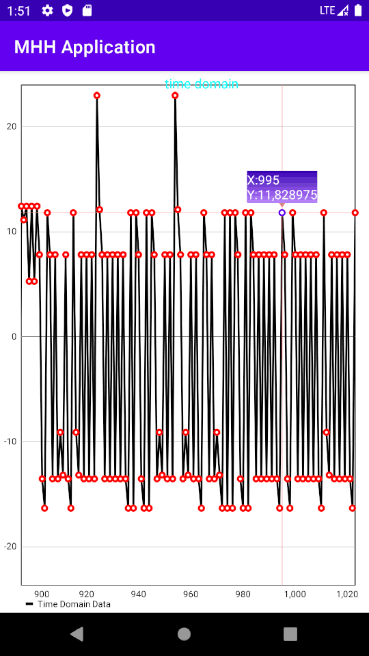
下面是图表画出来的样子~如果你觉得可能会对你有帮助,那么就接着往下看吧,冲!

基本使用步骤
【注意】chart 使用分为两大部分,第一部分可以实现基本绘图,第二部分便是 MarkerView——点击出现具体数据。
1.添加依赖
在 project 的 build.gradle 中添加依赖
allprojects {
    repositories {
        ...
        maven { url 'https://jitpack.io' }
    }
}
在 app 的 build.gradle 中添加依赖:
dependencies {
    implementation 'com.github.PhilJay:MPAndroidChart:v3.1.0'
}
2.配置 xml
在 Activity 对应的 Layout.xml 中配置所要使用的图表——可以把它看做一个控件,除了 android:id 属性外,其他需要自行配置。
<com.github.mikephil.charting.charts.LineChart
        android:id="@+id/mChart"
        android:layout_width="match_parent"
        android:layout_height="match_parent"
        android:layout_marginTop="100dp"
        android:layout_marginLeft="5dp"
        android:layout_marginRight="5dp"
        android:layout_marginBottom="10dp"/>
3. java 配置图表“骨架”
新建一个包 util,新建一个类 chart_util,这个类完成图表的基本配置和添加删除数据功能。代码如下:
package “你滴包名🤩”;

import android.graphics.Color;

import com.github.mikephil.charting.charts.LineChart;
import com.github.mikephil.charting.components.Description;
import com.github.mikephil.charting.components.Legend;
import com.github.mikephil.charting.components.XAxis;
import com.github.mikephil.charting.components.YAxis;
import com.github.mikephil.charting.data.Entry;
import com.github.mikephil.charting.data.LineData;
import com.github.mikephil.charting.data.LineDataSet;
import com.github.mikephil.charting.interfaces.datasets.ILineDataSet;
import com.github.mikephil.charting.utils.ColorTemplate;

public class chart_util {
    public static void chart_init(LineChart chart) {
        //chart.setOnChartValueSelectedListener(this);
        // enable description text
        chart.getDescription().setEnabled(true);
        // enable touch gestures
        chart.setTouchEnabled(true);

        /****************设置描述信息*************/
        Description description = new Description();
        description.setText("description here");
        description.setPosition(700, 50);
        description.setTextColor(Color.CYAN);                   //青色
        description.setTextSize(15);
        chart.setDescription(description);                      //设置图表描述信息
        chart.setNoDataText("No chart data available! Try to figure it.");                        //没有数据时显示的文字
        chart.setNoDataTextColor(Color.CYAN);                    //没有数据时显示文字的颜色
        chart.setDrawGridBackground(false);                     //chart 绘图区后面的背景矩形将绘制
        chart.setDrawBorders(true);                            //绘制图表边框的线
        // enable scaling and dragging
        chart.setDragEnabled(true);
        chart.setScaleEnabled(true);
        chart.setDrawGridBackground(false);

        //set chart 动画~
        //chart.animateX(8000);

        // if disabled, scaling can be done on x- and y-axis separately
        chart.setPinchZoom(false);

        // set an alternative background color
        //chart.setBackgroundColor(0x4169E1FF);

        LineData data = new LineData();
        data.setValueTextColor(Color.BLACK);

        // add empty data
        chart.setData(data);

        // get the legend (only possible after setting data)
        Legend l = chart.getLegend();

        // modify the legend ...
        l.setForm(Legend.LegendForm.LINE);
        l.setTextColor(Color.BLACK);
        //x轴配置
        XAxis xl = chart.getXAxis();
        //xl.setTypeface(tfLight);
        xl.setTextColor(Color.BLACK);
        xl.setDrawGridLines(false);
        xl.setAvoidFirstLastClipping(true);
        xl.setEnabled(true);
        xl.setPosition(XAxis.XAxisPosition.BOTTOM);               //X轴文字显示位置
        //左y轴配置
        YAxis leftAxis = chart.getAxisLeft();
        leftAxis.setTextColor(Color.BLACK);
        leftAxis.setAxisMaximum(30f);
        leftAxis.setAxisMinimum(0f);
        leftAxis.setDrawGridLines(true);
        //右y轴配置
        YAxis rightAxis = chart.getAxisRight();
        rightAxis.setEnabled(false);
    }

    public static void addEntry(LineChart chart, float Concentration_data) {
        LineData data = chart.getData();
        YAxis leftAxis = chart.getAxisLeft();
        if (data != null) {
            ILineDataSet set = data.getDataSetByIndex(0);
            // set.addEntry(...); // can be called as well
            if (set == null) {
                set = createSet();
                data.addDataSet(set);
            }

            data.addEntry(new Entry(set.getEntryCount(), Concentration_data), 0);
            leftAxis.setAxisMaximum(data.getYMax() + 1);
            leftAxis.setAxisMinimum(data.getYMin() - 1);


            data.notifyDataChanged();
            chart.notifyDataSetChanged();
            chart.setVisibleXRangeMaximum(128);                //设置一次最多显示的数据个数
            chart.moveViewToX(data.getEntryCount());
        }
    }

    private static LineDataSet createSet() {
        LineDataSet set = new LineDataSet(null, "Time Domain Data");
        set.setAxisDependency(YAxis.AxisDependency.LEFT);
        set.setColor(Color.BLACK);
        set.setCircleColor(Color.RED);
        set.setLineWidth(2f);
        set.setCircleRadius(4f);
        set.setFillAlpha(65);
        set.setFillColor(ColorTemplate.getHoloBlue());
        set.setHighLightColor(Color.rgb(244, 117, 117));
        set.setValueTextColor(Color.RED);
        set.setValueTextSize(7f);
        set.setDrawValues(true);
        return set;
    }
}
4. Activity 中使用 chart
步骤:
-
导入相关包,这一步可以省略,代码复制进去后,自行找错误部分导入即可
import androidx.appcompat.app.AppCompatActivity; import android.graphics.Color; import android.os.Bundle; import android.text.InputFilter; import com.example.activitytest.R; import com.example.activitytest.databinding.ChartLayoutBinding; import com.example.activitytest.util.chart_util; import com.github.mikephil.charting.charts.LineChart; import com.github.mikephil.charting.components.Description; import com.github.mikephil.charting.components.Legend; import com.github.mikephil.charting.data.Entry; import com.github.mikephil.charting.data.LineData; import com.github.mikephil.charting.data.LineDataSet; import com.github.mikephil.charting.interfaces.datasets.ILineDataSet; import java.util.ArrayList; import java.util.Random; -
在需要设置 chart 的 Activity 中,加入这些全局变量:
private LineChart chart; -
在
onCreate()方法中加入如下代码,注意dataShowMhh()这个方法是向 Chart 中添加数据的方法,各位应该根据自己的需求,更改这个方法的相关内容。chart = (LineChart) findViewById(R.id.mChart); //获取对象——也可使用 ViewBinding,但是推荐直接复制这个进去,万无一失! chart_util.chart_init(chart); //初始化刚刚获取的对象——折线图 dataShowByMhh(); //静态画图 -
在你的 xxxActivity 类中加入如下代码,用来给表格加入数据、退出时取消绑定服务以及广播监听:
private void dataShowByMhh() {
    double[] data = {-16.309092, 11.828975......};
    for (int i = 0; i < data.length; i++){
        chart_util.addEntry(chart, (float) data[i]);
    }
}

@Override
protected void onDestroy() {
    super.onDestroy();
}
完成以上步骤,你的 Activity 就可以绘图了,但是要想点击某个具体点,出现其信息,需要执行以下步骤:
MarkerView 配置步骤
0.设置背景图片
在 drawable 文件夹下,添加点击某点出现的视图背景。
添加背景:
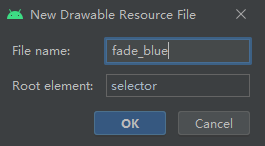
- 右键 drawable 文件夹,New 👉 Drawable Resource File

-
命名为 fade_blue

-
在 fade_blue.xml 文件加入代码:
<?xml version="1.0" encoding="utf-8"?>
<shape xmlns:tools="http://schemas.android.com/tools"
    xmlns:android="http://schemas.android.com/apk/res/android"
    tools:ignore="ResourceName"
    android:shape="rectangle">
    <gradient
        android:startColor="@color/design_default_color_primary_variant"
        android:endColor="@color/purple_200"
        android:angle="270"
        />
</shape>
添加点击高亮
- 与上面步骤一致,右键 drawable 文件夹,New 👉 Drawable Resource File

-
命名为 ic_brightness_curve_point,同上。
-
在 ic_brightness_curve_point.xml 中加入代码:
<?xml version="1.0" encoding="utf-8"?>
<shape xmlns:android="http://schemas.android.com/apk/res/android"
    android:shape="oval"
    >
    <solid android:color="@color/white" />
    <stroke
        android:width="2dp"
        android:color="@color/design_default_color_primary" />
    <size
        android:width="8dp"
        android:height="8dp" />
</shape>
1.重写 MarkerView
最好是在刚刚的 util 包中,新建一个类,命名为:CustomMPLineChartMarkerView,再添加以下代码:
package “你的包名别忘改~😨”;

import android.content.Context;
import android.graphics.Bitmap;
import android.graphics.BitmapFactory;
import android.graphics.Canvas;
import android.graphics.Paint;
import android.graphics.Path;
import android.graphics.RectF;
import android.graphics.drawable.Drawable;
import android.os.Build;
import android.util.TypedValue;
import android.widget.TextView;

import com.example.activitytest.R;
import com.github.mikephil.charting.charts.Chart;
import com.github.mikephil.charting.components.MarkerView;
import com.github.mikephil.charting.data.CandleEntry;
import com.github.mikephil.charting.data.Entry;
import com.github.mikephil.charting.highlight.Highlight;
import com.github.mikephil.charting.utils.Utils;

public class CustomMPLineChartMarkerView extends MarkerView {
    private final int DEFAULT_INDICATOR_COLOR = 0xff9966FF;//指示器默认的颜色——淡紫色
    private final int ARROW_HEIGHT = dp2px(5); // 箭头的高度
    private final int ARROW_WIDTH = dp2px(10); // 箭头的宽度
    private final float ARROW_OFFSET = dp2px(2);//箭头偏移量
    private final float BG_CORNER = dp2px(2);//背景圆角
    private final TextView tvContent;//文本
    private Bitmap bitmapForDot;//选中点图片
    private int bitmapWidth;//点宽
    private int bitmapHeight;//点高

    public CustomMPLineChartMarkerView(Context context) {
        super(context, R.layout.layout_for_custom_marker_view);
        tvContent = findViewById(R.id.tvContent);
        //图片自行替换
        bitmapForDot = getBitmap(context, R.drawable.ic_brightness_curve_point);
        if (bitmapForDot != null) {
            bitmapWidth = bitmapForDot.getWidth();
            bitmapHeight = bitmapForDot.getHeight();
        }
    }

    private static Bitmap getBitmap(Context context, int vectorDrawableId) {
        Bitmap bitmap = null;
        if (Build.VERSION.SDK_INT > Build.VERSION_CODES.LOLLIPOP) {
            Drawable vectorDrawable = context.getDrawable(vectorDrawableId);
            bitmap = Bitmap.createBitmap(vectorDrawable.getIntrinsicWidth(),
                    vectorDrawable.getIntrinsicHeight(), Bitmap.Config.ARGB_8888);
            Canvas canvas = new Canvas(bitmap);
            vectorDrawable.setBounds(0, 0, canvas.getWidth(), canvas.getHeight());
            vectorDrawable.draw(canvas);
        } else {
            bitmap = BitmapFactory.decodeResource(context.getResources(), vectorDrawableId);
        }
        return bitmap;
    }

    @Override
    public void refreshContent(Entry e, Highlight highlight) {
        if (e instanceof CandleEntry) {
            CandleEntry ce = (CandleEntry) e;
            tvContent.setText(Utils.formatNumber(ce.getHigh(), 6, true));
        } else {
            tvContent.setText(" X:"+Utils.formatNumber(e.getX(), 0, false)+"\n Y:"
                    +Utils.formatNumber(e.getY(), 6, true)+" ");
        }

        super.refreshContent(e, highlight);
    }

    @Override
    public void draw(Canvas canvas, float posX, float posY) {
        Chart chart = getChartView();
        if (chart == null) {
            super.draw(canvas, posX, posY);
            return;
        }

        //指示器背景画笔
        Paint bgPaint = new Paint();
        bgPaint.setStyle(Paint.Style.FILL);
        bgPaint.setAntiAlias(true);
        bgPaint.setColor(DEFAULT_INDICATOR_COLOR);
        //剪头画笔
        Paint arrowPaint = new Paint();
        arrowPaint.setStyle(Paint.Style.FILL);
        arrowPaint.setAntiAlias(true);
        arrowPaint.setColor(DEFAULT_INDICATOR_COLOR);

        float width = getWidth();
        float height = getHeight();

        int saveId = canvas.save();
        //移动画布到点并绘制点
        canvas.translate(posX, posY);
        if (bitmapForDot != null) {
            canvas.drawBitmap(bitmapForDot, -(float) bitmapWidth / 2f, -(float) bitmapHeight / 2f, null);
        }
        //画指示器
        Path path = new Path();
        RectF bRectF;
        if (posY < height + (float)ARROW_HEIGHT + ARROW_OFFSET + (float)bitmapHeight / 2f) {//处理超过上边界
            //移动画布并绘制三角形和背景
            canvas.translate(0, height + (float)ARROW_HEIGHT + ARROW_OFFSET + (float)bitmapHeight / 2f);
            path.moveTo(0, -(height + (float)ARROW_HEIGHT));
            path.lineTo((float)ARROW_WIDTH / 2f, -(height - BG_CORNER));
            path.lineTo(- (float)ARROW_WIDTH / 2f, -(height - BG_CORNER));
            path.lineTo(0, -(height + (float)ARROW_HEIGHT));

            bRectF=new RectF(-width / 2, -height, width / 2, 0);

            canvas.drawPath(path, arrowPaint);
            canvas.drawRoundRect(bRectF, BG_CORNER, BG_CORNER, bgPaint);
            canvas.translate(-width / 2f, -height);
        } else {//没有超过上边界
            //移动画布并绘制三角形和背景
            canvas.translate(0, -height - (float)ARROW_HEIGHT - ARROW_OFFSET - (float)bitmapHeight / 2f);
            path.moveTo(0, height + (float)ARROW_HEIGHT);
            path.lineTo((float)ARROW_WIDTH / 2f, height - BG_CORNER);
            path.lineTo(- (float)ARROW_WIDTH / 2f, height - BG_CORNER);
            path.lineTo(0, height + (float)ARROW_HEIGHT);

            bRectF=new RectF(-width / 2, 0, width / 2, height);

            canvas.drawPath(path, arrowPaint);
            canvas.drawRoundRect(bRectF, BG_CORNER, BG_CORNER, bgPaint);
            canvas.translate(-width / 2f, 0);
        }
        draw(canvas);
        canvas.restoreToCount(saveId);
    }

    private int dp2px(int dpValues) {
        return (int) TypedValue.applyDimension(
                TypedValue.COMPLEX_UNIT_DIP, dpValues,
                getResources().getDisplayMetrics());
    }
}
2.为刚刚的 MarkerView 配置布局
点击某点出现的内容也是一个小的界面——自然需要布局
在 layout 文件夹下,右键 New 👉 XML 👉 Layout XML File,命名为:layout_for_custom_marker_view,在 xml 文件中加入 code 如下:
<?xml version="1.0" encoding="utf-8"?>
<LinearLayout xmlns:android="http://schemas.android.com/apk/res/android"
    android:layout_width="wrap_content"
    android:layout_height="wrap_content"
    android:background="@drawable/fade_blue"
    android:orientation="vertical">

<!--    这是纵坐标-->

    <TextView
        android:id="@+id/tvContent"
        android:layout_width="wrap_content"
        android:layout_height="wrap_content"
        android:textColor="@android:color/white" />

</LinearLayout>
3.为你的 chart 配置 MarkerView
在你刚刚使用 Chart 的 Activity 类中的 onCreate() 方法中,添加如下代码,但是务必添加在初始化 chart 代码之后。
//点击显示文本
CustomMPLineChartMarkerView mv = new CustomMPLineChartMarkerView(this);
mv.setChartView(chart);
chart.setMarker(mv);
😎完成这一步,你的 Chart 就可以响应了~