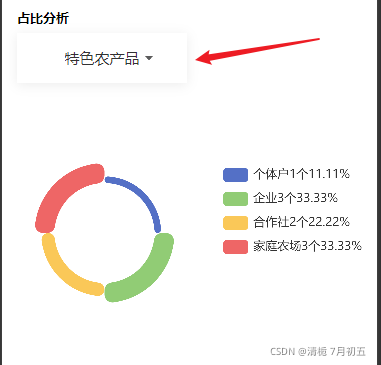
1.在微信wxml上面写一个容器
<view class="my-chart" >
	<ec-canvas id="mychart-dom" canvas-id="mychart" ec="{{ trendEc }}"></ec-canvas>
</view>
2.并在容器上面写宽高,不然渲染不出来
.my-chart{
	width: 700rpx;
	height: 600rpx;
}
3.在JS中的data赋值
data:{
    trendEc:{
			onInit: getAnalysis
		},
}
4.初始echarts(在page外面)
function getAnalysis(canvas, width, height, dpr,){
	chart=echarts.init(canvas,null,{
		width: width,
    height: height,
    devicePixelRatio: dpr // new
	})
	canvas.setChart(chart)
	return chart
}
5.从后端获取数据
async	getRatioAnalysis(){
	wx.showLoading({
		title: '加载中',
})
		const parameter={industryType:this.data.dictValue}
		const analysis=await  getRatioAnalysis(parameter)
		analysis.data.list.map(item=>{
			item.name=item.type_name+item.type_count+'个'+item.ratio+'%'
			item.value=item.type_count
		})
		const option=this.getAnalyOption(analysis.data.list)
		if (chart) chart.setOption(option, true, true)
		wx.hideLoading()
	},
6.最后把数据加载到echarts(在page里面)
getAnalyOption(data=[]){
const option={
		legend: {
			type: 'scroll',
			orient: 'vertical',
			right: 0,
			top: 80,
			bottom: 20,
						},
		toolbox: {
				show: true,
				feature: {
						mark: {show: true},
				}
		},
		series: [
				{
						name: '',
						type: 'pie',
						radius: [50, 70],
						center: ['25%', '50%'],
						roseType: 'area',
						label: {
														show: false,
														position: 'center'
												},
												emphasis: {
														label: {
																show: true,
																fontSize: '20',
																fontWeight: 'bold'
														}
												},
						itemStyle: {
								borderRadius: 8
						},
						data
				}
		]
		}
		return option
	}
最后,这里有很多细节没写。细节看1.0版本? ?这个版本主要方便改变里面的数据
像这种的

?