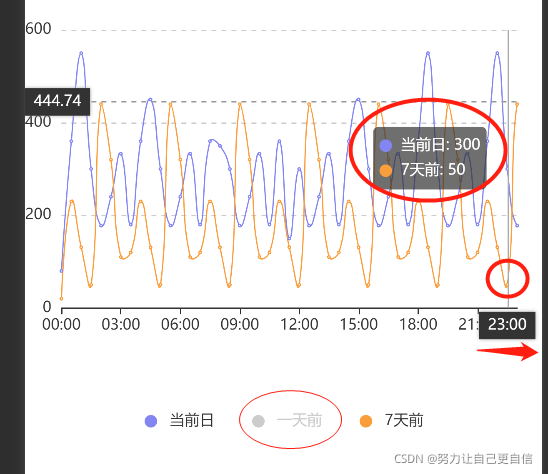
###1.效果图

2.html代码如下
<view class="container">
  <ec-canvas id="mychart-dom-line" canvas-id="mychart-line" ec="{{ ec }}"></ec-canvas>
</view>
3.json文件
{
  "usingComponents": {
    "ec-canvas": "../../ec-canvas/ec-canvas"
  }
}
3.js代码如下
import * as echarts from '../../ec-canvas/echarts';

const app = getApp();


function initChart(canvas, width, height, dpr) {
  const chart = echarts.init(canvas, null, {
    width: width,
    height: height,
    devicePixelRatio: dpr // new
  });
  canvas.setChart(chart);

  var option = {
    title: {
      text:'-对比图' // 图表头部title
    },
    color: ["#8385f3", "#40beff", "#fa9d3b"],
    grid: {
      left: "0%",
      right: "5%", //图表距离左右的距离
      containLabel: true,
      height: "60%", // 图表占画布的高度
    },
    tooltip: {
      show: true,
      trigger: 'axis',
      axisPointer: {
        type: 'cross',
        axis: 'x',
      }
    },
    legend: {  // 底部三个标题的样式
      itemWidth: 20,  // 下部一天七天分类的宽高
      itemHeight: 10,
      itemGap: 30, // 一天七天两者间隔的距离
      icon:'circle', // 设置当前天数前边的标志是圆的
      bottom:'20',
    },
    xAxis: {
      type: 'category',
      axisTick: { show: true }, // 控制x轴刻度尺是否显示
      axisLine: { show: true },
      splitLine:{
        lineStyle:{
          width:2
        }
      },
      boundaryGap: false, // 控制样式到左右有两端
      data: ['00:00', '00:30','01:00','01:30',"02:00",'02:30', '03:00','03:30','04:00','04:30','05:00','05:30', '06:00', ], // x轴刻度尺数据
      axisLabel: {
        interval:5,//代表显示x轴刻度点,0代表显示所有,5代表中间间隔5个点
    }
    },
    yAxis: {
      x: 'center',
      type: 'value',
      splitLine: {
        lineStyle: {
          type: 'dashed'
        }
      },
      scale: true,
      max: 600,
      min: 0,
      splitNumber: 3,
      show:true,
      axisTick: { show: false },// 控制y轴刻度尺是否显示
      axisLine: { show: false },
    },
    series: [{
      name: '当前日', /
      type: 'line',
      smooth: true, // 折线是弧线/或者直线
      hoverAnimation:false, // 控制节点移入时是否变大
      symbolSize: 2, // 节点的大小
      itemStyle:{
        normal:{
            lineStyle:{
                width:1, // 折线的粗细
            }
        }
    },

      data: [80, 360, 550, 300, 178, 240, 333,180, 360, 450, 300, 178, 240, 333,180, 360, 350, 300, ]
    }, {
      name: '一天前',
      type: 'line',
      smooth: true,
      hoverAnimation:false,
      symbolSize: 2,
      itemStyle:{
        normal:{
            lineStyle:{
                width:1,
            }
        }
    },
      data: [12, 150, 151, 235, 370, 430, 520,112, 150, 151, 235, 370, 430, 520,112, 150, 151]
    }, {
      name: '7天前',
      type: 'line',
      symbolSize: 2,
      smooth: true,
      hoverAnimation:false,
      itemStyle:{
        normal:{
            lineStyle:{
                width:1,
            }
        }
    },
      data: [20, 230, 131, 50, 440, 320, 110,120, 230, 131, 50, 440, 320, 110,120, 230, 131, 50, 440, 320, 110,120, 230, 131, 50, 440, 320, 110,120, 230, 131, 50, 440, 320, 110,120, 230, 131, 50, 440, 320, 110,120, 230, 131, 50, 440, 320,]
    }]
  };

  chart.setOption(option);
  return chart;
}

Page({
  onShareAppMessage: function (res) {
    return {
      title: 'ECharts 可以在微信小程序中使用啦!',
      path: '/pages/index/index',
      success: function () { },
      fail: function () { }
    }
  },
  data: {
    ec: {
      onInit: initChart
    }
  },

  onReady() {
  }
});