首先php.ini里面的xdebug3配置如下
zend_extension = /opt/homebrew/lib/php/pecl/20190902/xdebug.so
xdebug.idekey=PHPSTORM
#xdebug.mode=debug
#xdebug.start_with_request=yes
xdebug.client_port=9999
xdebug.mode = debug,profile
xdebug.start_with_request = yes|trigger
xdebug.output_dir = /data/profiler_dir
xdebug.profiler_append = 0
xdebug.profiler_output_name = cachegrind.out.%p
多个模式mode用逗号隔开
start_with_request用|隔开,一一对应
如果不适用其他模式,只需要debug,设置
xdebug.mode=debug即可,和xdebug2不太一样,不需要设置其他
xdebug2的profiler配置如下
; profiler
xdebug.profiler_enable = on;            ; 关闭永久生成profiler
xdebug.profiler_enable_trigger = 1;    ; 启用 session 触发 profiler
xdebug.profiler_output_dir = "/data/profiler_dir"   ; 输出的目录
xdebug3简化了许多配置项,profiler_output_dir 统一output_dir
查看PHPinfo
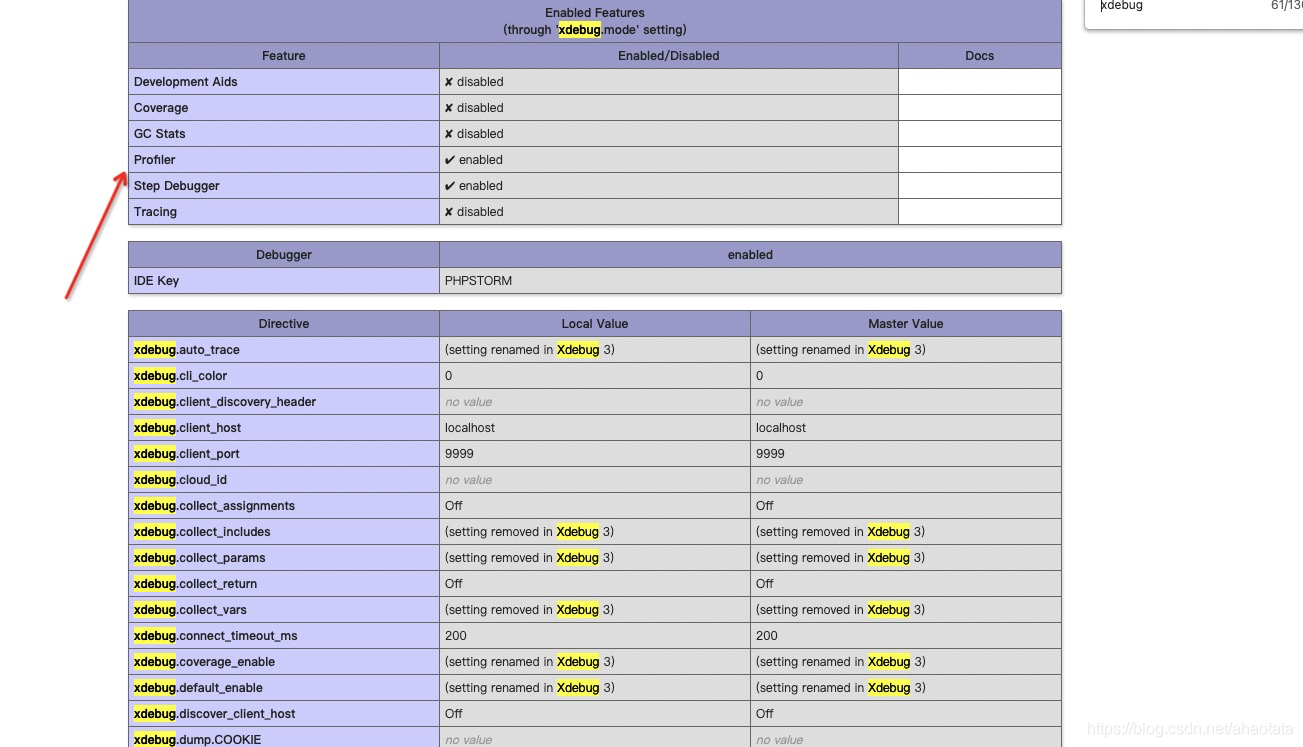
打开浏览器检查,可以看到生成的文件路径,名称

打开文件夹,可以看到已经生成了一些文件

用phpstorm的工具打开文件分析
Tools > Analyze Xdebug Profiler Snapshot
在tools下
