Step through your app��s state on the GPU using various Metal tools in Xcode.
����:��Xcode��ʹ��Metal�����������Կ��ij���״̬
˵��:������Ҫ���ǰ��һ������������ Metal���ԡ�
û���������ݡ�
Overview
To understand how the computer runs your app or to debug problems, you typically use a debugger. Traditional��ͳ�� debuggers work by pausing on a single thread, but this doesn��t work very well with Metal apps. Xcode provides�ṩ�� a debugger specifically����Եĵ����� for Metal through its frame capture workflow.
To debug a Metal app with the Metal debugger, you capture���� a single frame of animation and examine the commands that the app generated to create it.
In this article, you run the Using a Render Pipeline to Render Primitives example through Xcode��s Metal debugger to learn how to examine a Metal app at runtime. ��ƪ�ĵ�,ͨ�����С�Using a Render Pipeline to render Primitives������������metal������,��ѧϰ���ʵʱ���Metal�������С�
Enable the Metal Debugger in the Xcode Project
In the Rendering example, go into the project��s build settings and change the Metal compiler options so that the debug information includes source code for your shaders. Set ��Produce debugging information�� for Debug to ��Yes, include source code��.
����ͼ��ʾ��Metal������

Apps shipped to customers shouldn��t contain debugging information, so set Release to No.
Capture a Frame ����һ֡
The Metal Debugger works in conjunction��� with Xcode��s Metal frame capture feature. To use the Metal Debugger, first you capture a frame using the following steps. ����ʹ�����沽�貶��һ֡��
Build and run your project. In the case of Using a Render Pipeline to Render Primitives, the app displays a triangle.
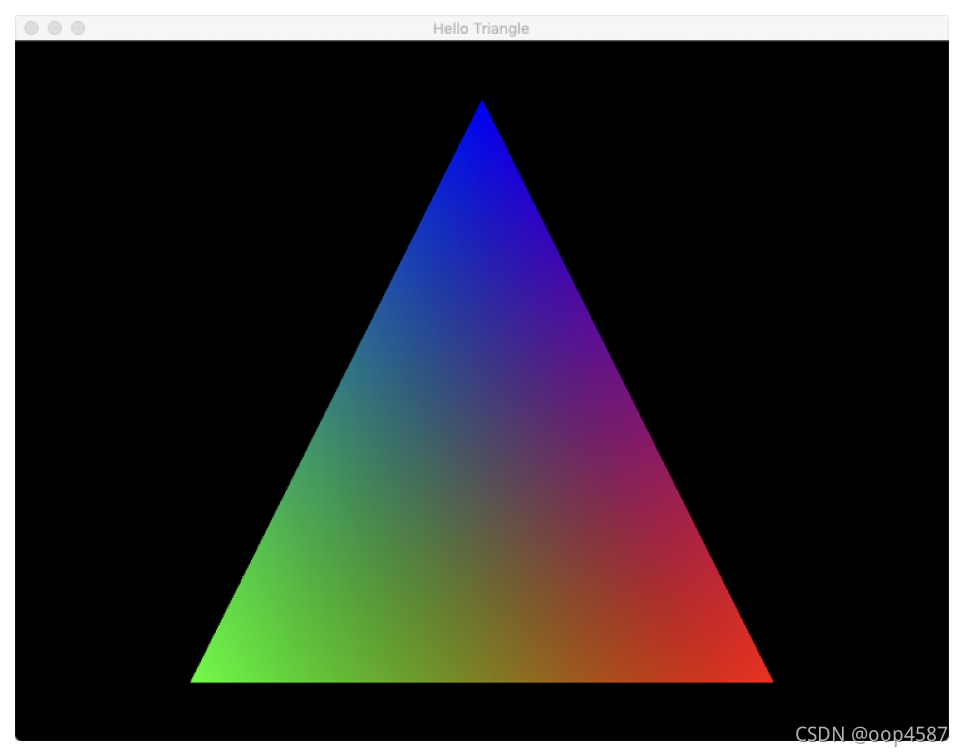
While the app is running, return to Xcode and click the camera icon on the debugging toolbar: ��Xcode�汾Version 13.0 (13A233)��,ͼ����Ϊ��M������ͼ�ꡣmetal��Ϊһ���µ�ƻ��openGL,�汾�仯�ϴ�,��Ҫע�⡣

Inspect Your Draw Call �����Ļ�ͼ����
The Using a Render Pipeline to Render Primitives app draws a triangle by calling drawPrimitives(type:vertexStart:vertexCount:). Xcode captures this draw call and all of the other function calls you made in the frame and displays those in the Debug navigator, shown below.
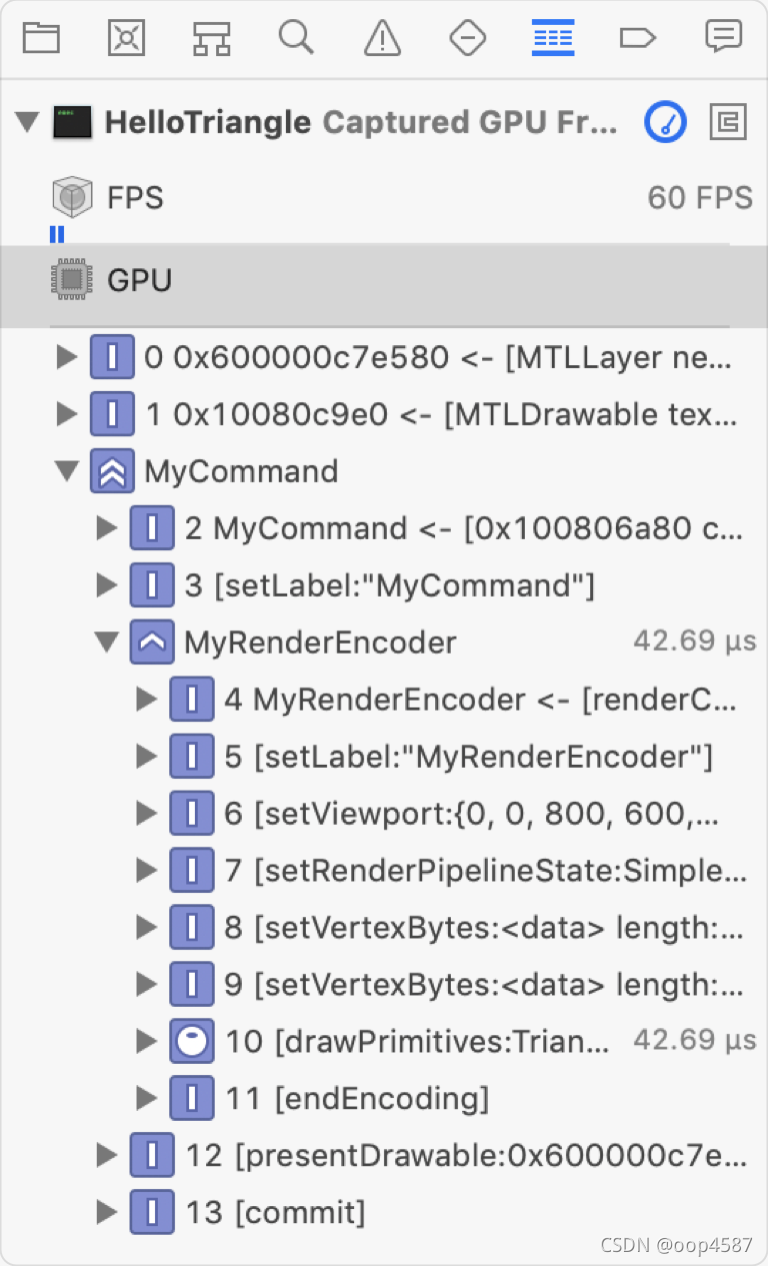
If your draw call rendered in the wrong color or screen location, you identify it in the captured frame to get more information about why.
The MyRenderEncoder group shows the commands that Metal executed to create the triangle. Xcode records your calls to set the viewport, the render pipeline state, arguments for the vertex function, and finally a command to draw the triangle. Click the draw call to select it.
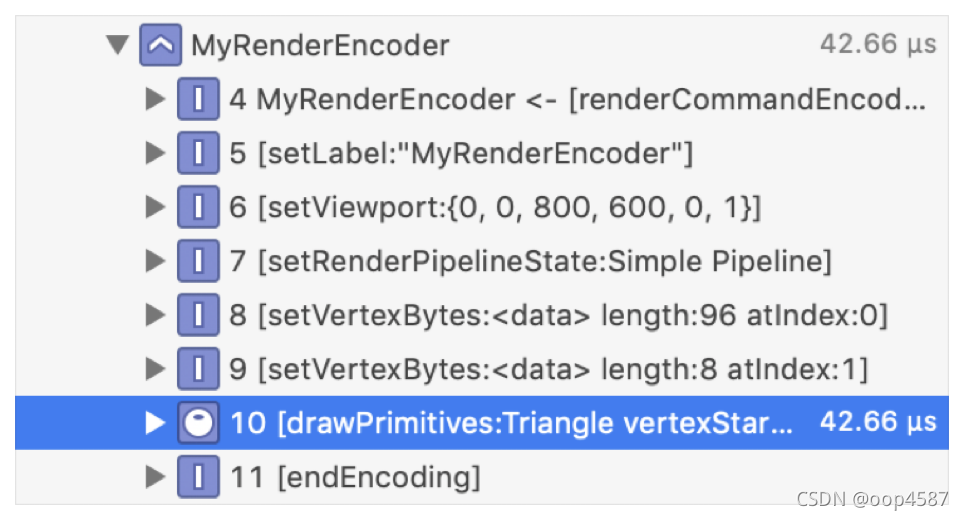
In the main view, Xcode shows you the details of the draw call separated into categories�C�CVertex, Fragment, and Attachment.

Each one represents a stage of the draw call. Analyze���� these stages in more detail to figure outָ�� the cause of an issue��������, as shown in the following sections.
Inspect Your Vertices in the Geometry Viewer �ڼ�����ͼ�в鿴��Ķ���
The vertex stage displays a collection of vertices which correspond to your app��s primitives, also referred to as meshes, or geometry. To visually inspect this data for any issues, double-click Geometry.
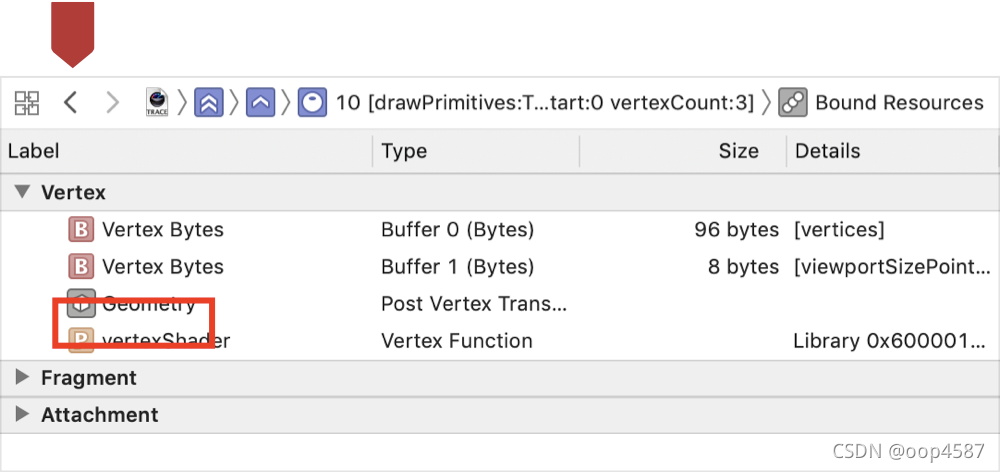
Xcode renders a wireframe�߿� of the vertex stage��s output in a geometry viewer. Below that, Xcode lists the same data in a table. Click a vertex in the wireframe, and Xcode selects its corresponding��Ӧ�� row in the table.
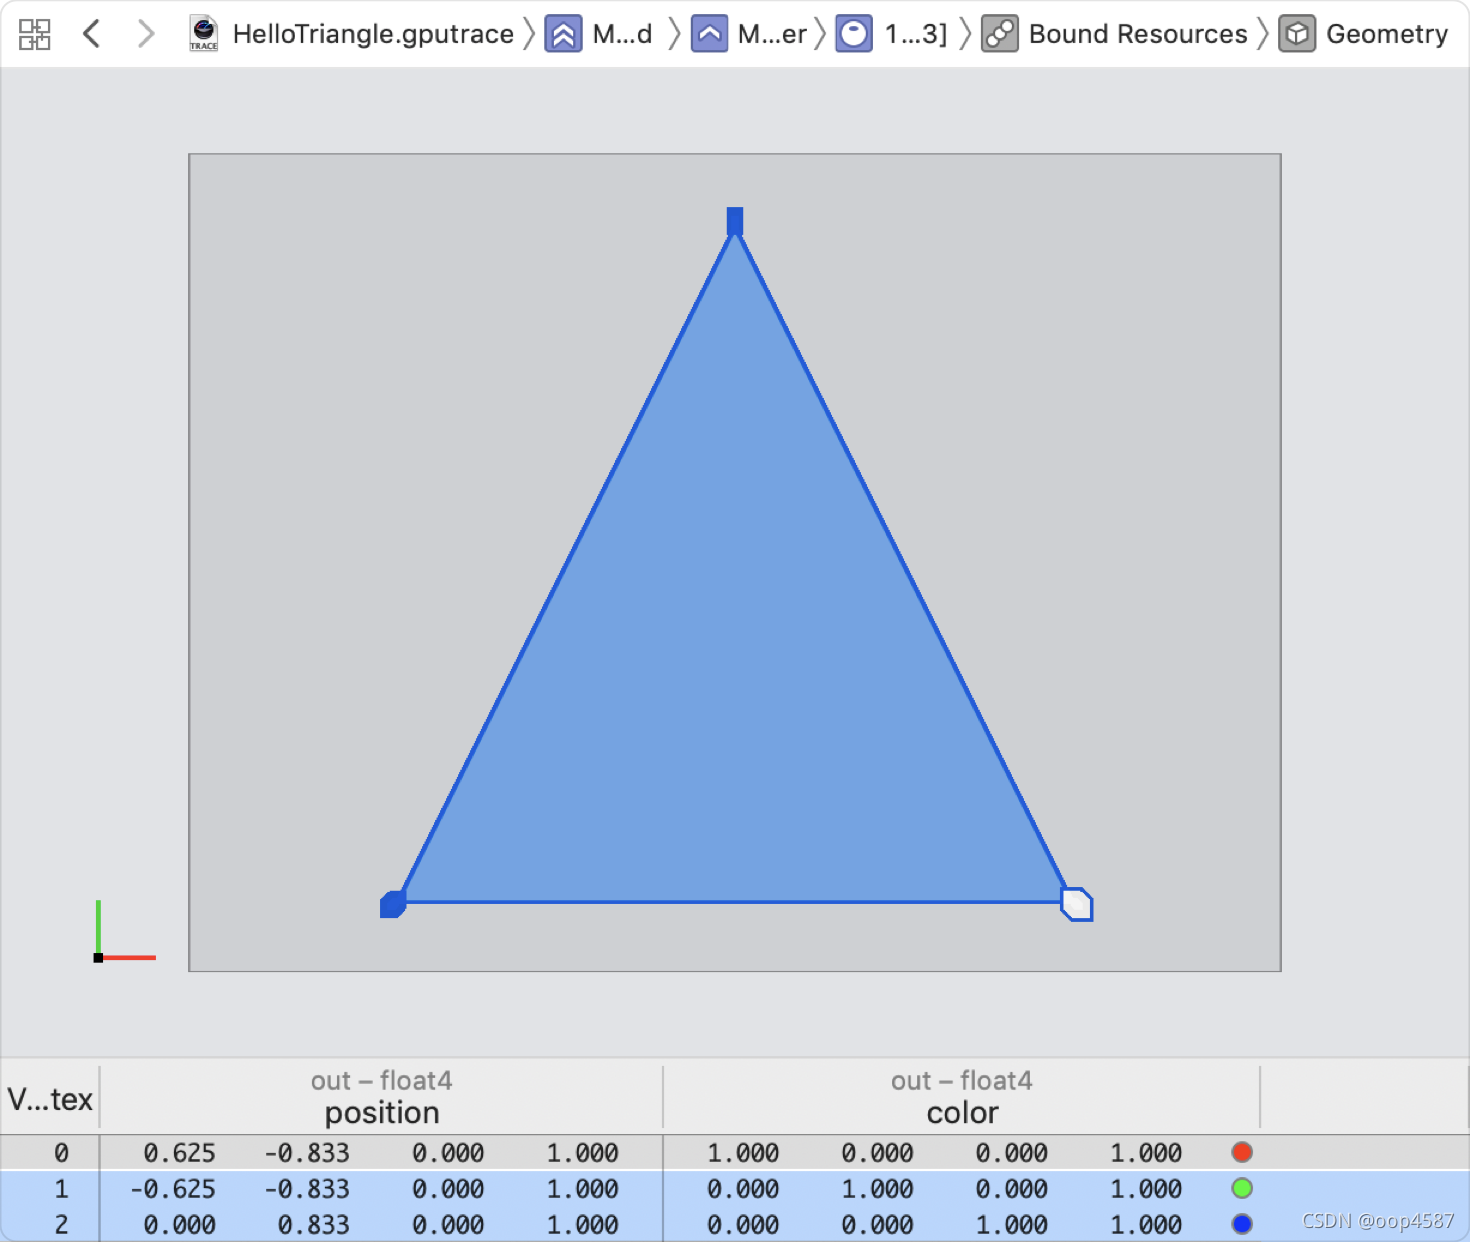
By checking out the vertex information in this way, you can ensure that visually and numerically, the vertex output looks correct.
If there were misplaced�Ŵ��ط� vertices on screen, it��s possible the error lies in the data you provided to the vertex function. Bound Resources also lists your vertex stage inputs, so check there for any discrepancies���� by navigating back using the left-directional in the breadcrumb(���������<��ͷ).

See your inputs to the vertex function that Xcode lists at the top.
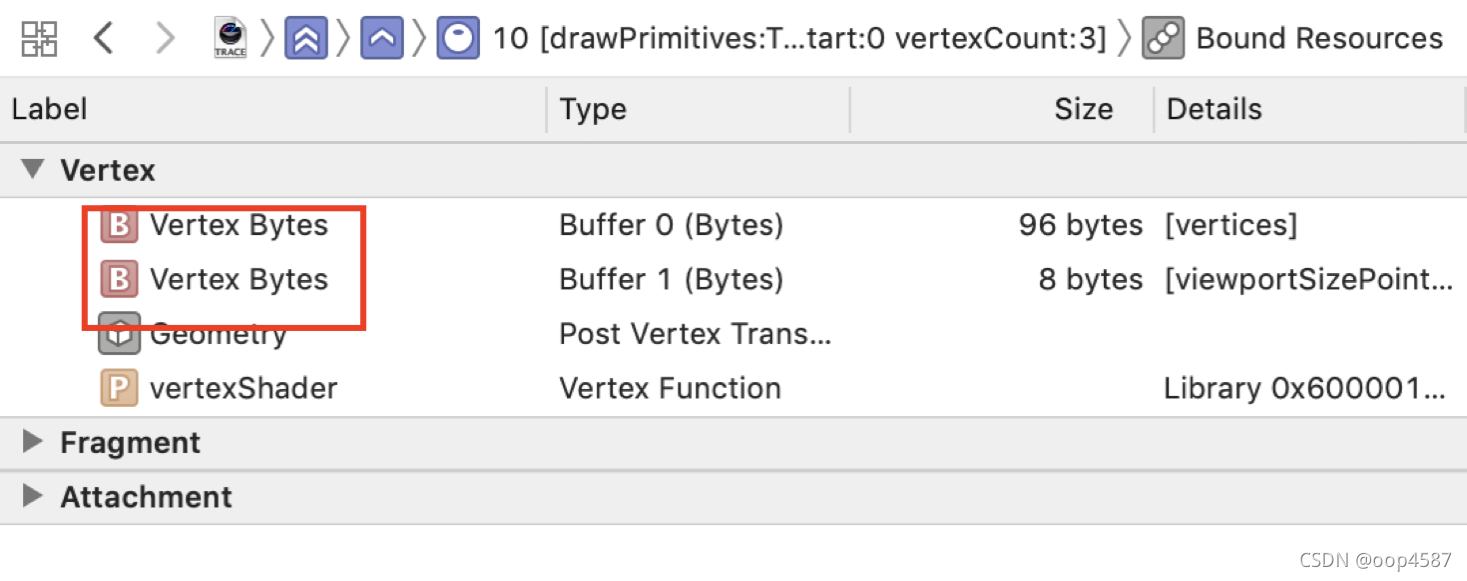
Double-click the first vertex buffer and Xcode displays the buffer��s contents in a table.

Each row identifies��Ӧ one vertex, including its position and color. Xcode renders a preview of the color to the right of the vertex��s numeric color data. If this table reflects��ӳ values you don��t expect, adjust your code or other source within your app that provides data to the vertex function to resolve the issue.
View Your Vertex Function in the Shader Debugger ����ɫ���������� �鿴��Ķ��㺯��
If one or more of your app��s vertices are rendered at an incorrect position or color, the issue may be caused by a mistake in your app��s vertex shader code. To check out that possibility, open your vertex function in the shader debugger using the following steps. Select one of your vertices (marked by callout 1 in the following image) and click the Debug button (marked by callout 2).
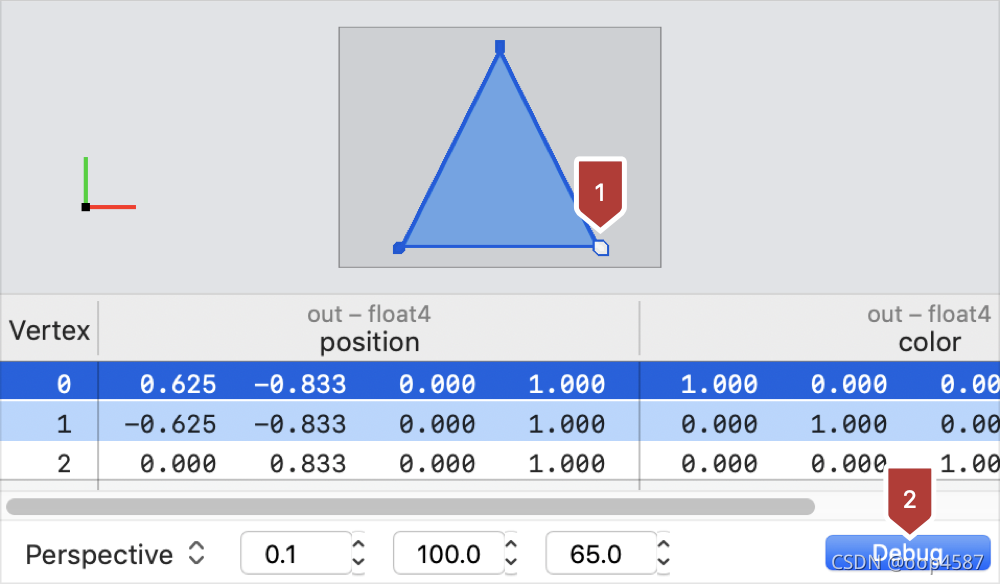
Xcode shows your vertex function��s source code in its shader debugger.

When the code opens, ensure it��s the shader you expect. Otherwise, the problem indicates you��re using the wrong rendering pipeline, or that you��ve misconfigured the rendering pipeline. Because you configure the rendering pipeline that includes the shaders, you should know which shader you intend to process the primitive you chose.
Next to each line of code, the shader debugger shows the values calculated and stored at the time the line was executed by the GPU.

Click the dot to the right of the calculated value that��s marked by callout 1 in the following image. Xcode shows you the calculated values for multiple vertices, marked by callout 2.

This enables you to compare the results of all vertex function calls in the same frame. Doing so can reveal inconsistencies that suggest there��s a bug in your shader code or input data.
View Your Fragment Function in the Shader Debugger ����ɫ���������в鿴���ƬԪ����
You can also see how the fragment function processed a specific fragment. To see how each line of code in your fragment shader determined the pixel��s output color, look to the attachments Xcode displays in the assistant editor.
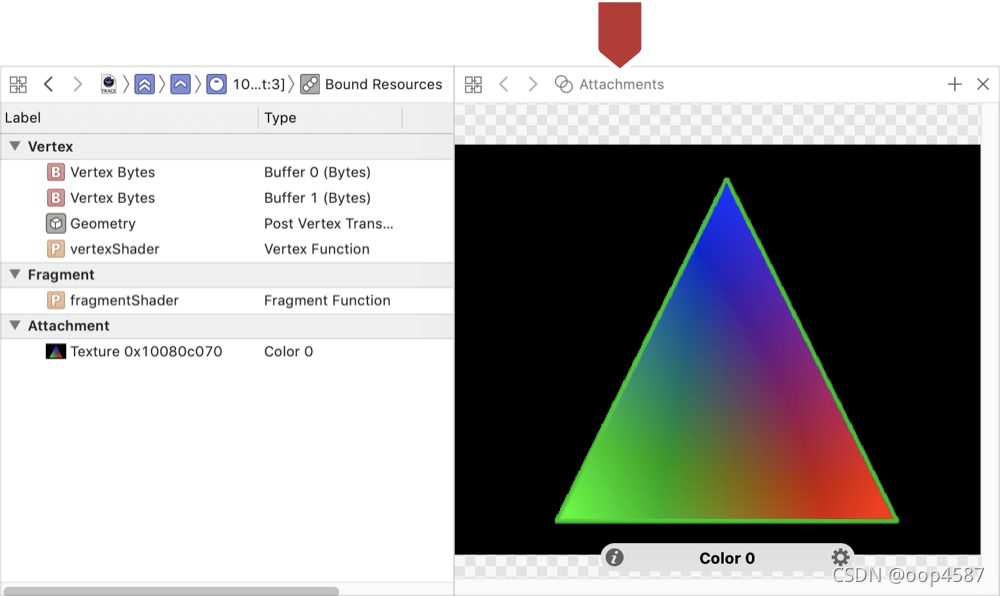
Click and hold the mouse until Xcode displays the targeting reticle. Move the mouse to choose a pixel.
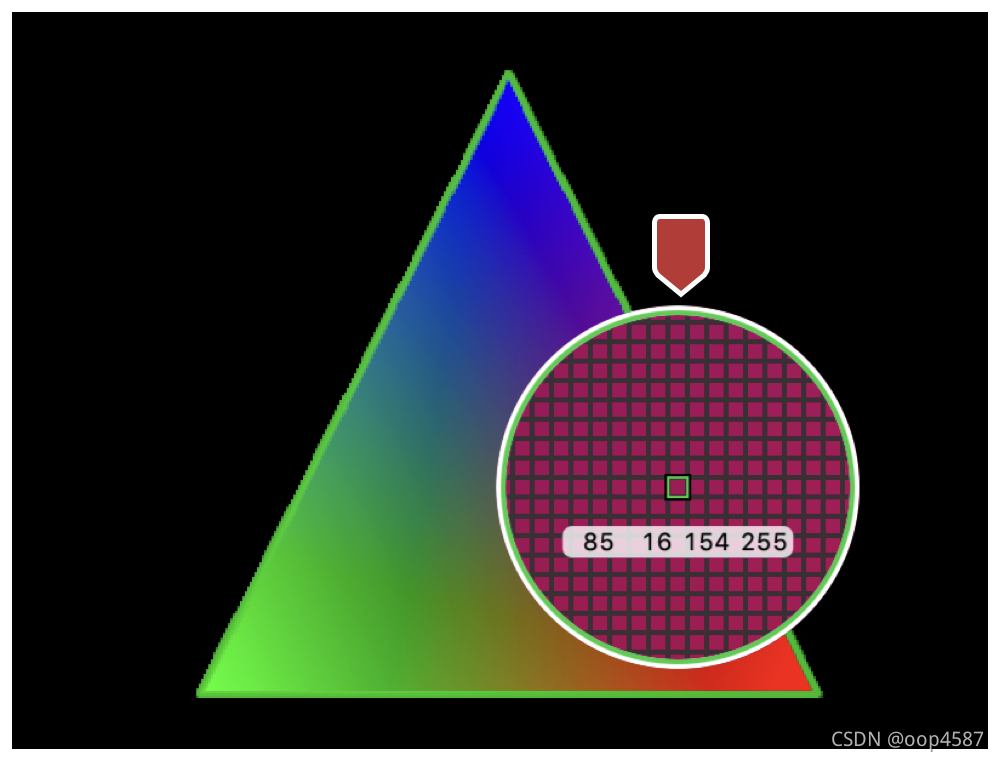
Click the Debug button.

Xcode opens your fragment function in the shader debugger, with the code lines annotated with the calculations for this pixel.

When the code opens, ensure it��s the shader you expect. Otherwise, the problem indicates���� you��re using the wrong rendering pipeline, or that you��ve misconfigured the rendering pipeline. Because you configure the rendering pipeline that includes the shaders, you should know which shader you intend to process the pixel you chose.
Click the dot to the right of the calculated value, marked by callout 1 in the following image. Xcode displays a visualization of the color your app returned for this pixel, marked by callout 2 in the following image.

If there were more lines in the Rendering app��s fragment shader, you could inspect those in a similar manner to understand how each line contributed to the output pixel color.
Metal provides many other great tools that you can use to debug and optimize your app��s performance and energy usage. For more information, see Tools.
��Viewing Your GPU Workload with the Metal Debugger ������