有监督学习–线性回归
一:算法原理
多元线性回归:每个 x 代表一个特征
模型:
[
y
1
y
2
.
.
.
y
p
]
=
[
1
,
x
11
,
x
12
,
.
.
.
,
x
1
p
1
,
x
21
,
x
22
,
.
.
.
,
x
2
p
.
.
.
1
,
x
n
1
,
x
n
2
,
.
.
.
,
x
n
p
]
?
[
w
0
w
1
.
.
.
w
p
]
=
w
0
+
X
W
\left[ \begin{matrix} y_1 \\ y_2 \\ ... \\ y_p \end{matrix} \right] = \left[ \begin{matrix} 1,x_{11},x_{12},...,x_{1p} \\ 1,x_{21},x_{22},...,x_{2p} \\ ... \\ 1,x_{n1},x_{n2},...,x_{np} \end{matrix} \right] * \left[ \begin{matrix} w_0 \\ w_1 \\ ... \\ w_p \end{matrix} \right] = w_0+XW
?????y1?y2?...yp???????=?????1,x11?,x12?,...,x1p?1,x21?,x22?,...,x2p?...1,xn1?,xn2?,...,xnp?????????????w0?w1?...wp???????=w0?+XW
目的:找到最好的 W
方法:最小二乘法
关键概念:损失函数
损失函数:模型表现越不好,则损失的信息越多,值代表误差平方和SSE,即预测值和观测值的误差平方和
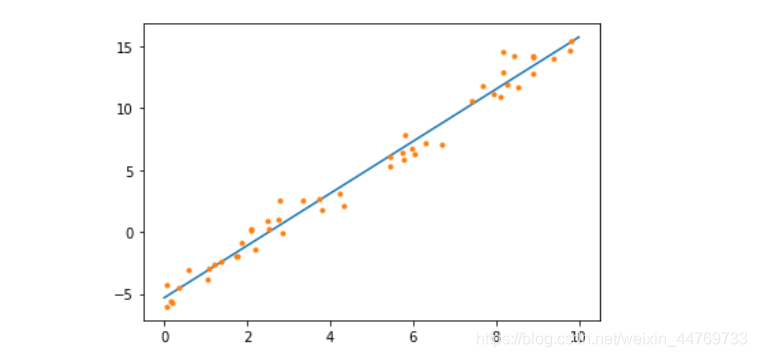
代码实现一元线性回归:
#一元线性回归
import pandas as pd
import numpy as np
import matplotlib.pyplot as plt
#设计数据
#加随机种子,干扰数据
np.random.seed(100)
x = np.random.rand(50)*10
np.random.seed(120)
y = 2*x - 5 + np.random.randn(50)
#画图
plt.plot(x,y,'.')
#########################################################################
#sklean实现线性回归
#1.导包
from sklearn.linear_model import LinearRegression
#2.实例化模型
lr = LinearRegression(fit_intercept=True) #fit_intercept=True 这个代表默认模型中存在截距
#3.训练模型
#3.1 注意上面x数据是一维的,需要转化成二维
x_x = x.reshape(-1,1)
#3.2训练
lr = lr.fit(x_x,y)
#############################################################
#查看模型效果
#1.看斜率
lr.coef_  # array([2.1022037])
#2.看截距
lr.intercept_ # -5.310986089436093
#所以模型 y = 2.1*x - 5.31
###############################################################
#将模型的直线绘制到散点图中
#1.生成 x 数据
x_prt= np.linspace(0,10,100) #表示从 0 到 10 ,生成100个均匀的数据
#2.转换 x_prt 的维度
x_prt = x_prt.reshape(-1,1)
#3.使用模型进行预测 y的值
y_prt = lr.predict(x_prt)
#画图
plt.plot(x_prt,y_prt) #模型直线
plt.plot(x,y,'.') #训练数据

二:房价预测Demo
模型拟合程度:
- MSE:平均残差 , (SSE是误差平方和, MSE=SSE/ m)
- R方:
#房价预测
#导包
import pandas as pd
import numpy as np
from sklearn.linear_model import LinearRegression #线性回归
from sklearn.model_selection import train_test_split #划分数据集
from sklearn.model_selection import cross_val_score #交叉验证
from sklearn.datasets import fetch_california_housing #加利福尼亚房屋价值数据

#1.数据处理
house_data = fetch_california_housing()
x_house = pd.DataFrame(house_data.data,columns=house_data.feature_names)
print(df_house.head())
y_house = house_data.target
print(y_house)

#2.拆分数据集
Xtrain,Xtest,Ytrain,Ytest = train_test_split(x_house,y_house,test_size=0.3,random_state=420)

#3.建模,实例化
lr = LinearRegression()
#4.训练模型
lr = lr.fit(Xtrain,Ytrain)
三:模型评估
3.1 MSE均方误差
MSE指标:
#5.模型评估
#5.1 训练集的 MSE(均方误差)
from sklearn.metrics import mean_absolute_error
#使用训练值进行预测
y_yuce = lr.predict(Xtrain) #预测值
#使用预测值 和 真实值进行对比,计算均方误差
mse = mean_absolute_error(Ytrain,y_yuce) # Ytrain 真实值,y_yuce预测值
print('均方误差=',mse) #均方误差= 0.530942761735602 , mse越小越好

#5.2 测试集的MSE(均方误差)
y_test_yuce = lr.predict(Xtest)
mse_test = mean_absolute_error(Ytest,y_test_yuce)
print('测试集mse=',mse_test) #测试集mse= 0.5307069814636152
MSE交叉验证:
#交叉验证
#1.MSE 均方误差
ls2 = LinearRegression()
mse = cross_val_score(ls2,Xtrain,Ytrain,cv=10,scoring='neg_mean_squared_error')
#cv=10 代表折10次
#scoring='neg_mean_squared_error'代表使用负的均方误差做交叉验证的参数,因为没有正的均方误差
mse.mean()
如何查询 scoring 参数:
import sklearn
sorted(sklearn.metrics.SCORERS.keys())
3.2 MAE 绝对均值误差(和MSE差不多,二者取其一即可)
#2.绝对均值误差 MAE , 与 MSE差不多,二者取其一即可
from sklearn.metrics import mean_absolute_error
mean_absolute_error(Ytrain,y_yuce)
#使用 MAE做交叉验证的参数  scoring='neg_mean_absolute_error'
3.3 R方
R方-方差,用于衡量s数据集包含多少信息量
R方越趋近于1,代表模型拟合效果越好
方式一:
from sklearn.metrics import r2_score

r2 = r2_score(Ytrain,y_yuce)
print('训练集R方值=',r2) #训练集R方值= 0.6067440341875014

r2_test = r2_score(Ytest,y_test_yuce)
print('测试集R方值=',r2_test) #测试集R方值= 0.6043668160178817
方式二:
#这个score方法返回的就是 R方值
lr.score(Xtrain,Ytrain) #0.6067440341875014
lr.score(Xtest,Ytest) #0.6043668160178817
交叉验证:
#交叉验证,求平均得分
lr2 = LinearRegression()
cross_val_score(lr2,Xtrain,Ytrain,cv=10,scoring='r2').mean() #0.6039238235546339
3.4 查看模型系数
w系数
lr.coef_

list(zip(x_house.columns,lr.coef_))
#系数结果 :
# [('MedInc', 0.4373589305968403),  代表:这个特性的w = 0.4373589305968403
#  ('HouseAge', 0.010211268294494038),
#  ('AveRooms', -0.10780721617317715),
#  ('AveBedrms', 0.6264338275363783),
#  ('Population', 5.216125353178735e-07),
#  ('AveOccup', -0.0033485096463336094),
#  ('Latitude', -0.4130959378947711),
#  ('Longitude', -0.4262109536208467)]
截距
lr.intercept_ #-36.25689322920386
#代表 w0 = -36.25689322920386
3.5 模型公式
根据3.4模型系数得出:
y = 0.43×MedInc+0.01×HouseAge-0.1×AveRooms+0.62×AveBedrms+0.0000005×Population-0.003×AveOccup-0.41×Latitude-0.42×Longitude-36.25
四:将数据集标准化之后再训练
标准化: 消除量纲的影响
from sklearn.preprocessing import StandardScaler
std = StandardScaler()
#1.对训练集进行标准化
Xtrain_std = std.fit_transform(Xtrain)

#2.实例化新的模型
lr_std = LinearRegression()

#3.使用标准化之后的训练集进行训练
lr_std = lr_std.fit(Xtrain_std,Ytrain)

#4.查看r方值
lr_std.score(Xtrain_std,Ytrain) #0.6067440341875014
五:绘制拟合图像
#绘制拟合图像
#1.绘制观测值
plt.scatter(range(len(Ytest)),sorted(Ytest),s=2,label='True') #排序之后再画图,否则点就太乱了,但是注意匹配预测值和真实值的位置,因为真实值排序了

#获取排序之后的索引值
index_sort = np.argsort(Ytest)

#预测值
y2 = lr.predict(Xtest)

#通过索引找到预测值的顺序
y3 = y2[index_sort]

#2.绘制预测值
plt.scatter(range(len(Ytest)),y3,s=1,label='Predict',alpha=0.3)
plt.legend()
plt.show()

六:多重共线性
即特征和特征之间存在高度相关性
from sklearn.preprocessing import PolynomialFeatures

#1.实例化

pl = PolynomialFeatures(degree=4).fit(x_house,y_house) #degree=2 这个值越大,计算速度越慢
pl.get_feature_names() #通过多项式构造列

#2.数据转化
x_trans = pl.transform(x_house)

#3.使用转化后的数据进行划分数据集
Xtrain,Xtest,Ytrain,Ytest = train_test_split(x_trans,y_house,test_size=0.3,random_state=420)

#4.训练数据
result = LinearRegression().fit(Xtrain,Ytrain)


#5.查看特征和相关系数
result.coef_
[*zip(pl.get_feature_names(x_house.columns),result.coef_)]

#6.查看变化之后的 R方值
result.score(Xtrain,Ytrain) #0.7705009887940618 , 把degree=4 调高的拟合效果更好