This blog will cover as below :
- The K-mens clustering algorithm(K-均值聚类算法)
- Cluster postprocessing (对聚类得到的簇进行后处理)
- Bisecting k-means(二分K-均值聚类算法)
Clustering is a type of unsupervised learning that automatically forms clusters of similar things.It's like automatic classification. In this blog, we're going to study one type of clustering algorithm called k-means.It's called k-means because it finds k unique clusters, and the center of each cluster is the mean of the value in that cluster. Clustering is sometimes called unsupervised classification because it produces the same result as classification but without having predefined classes.The notion of similarity depends on a similarity measurement. The type of similarity measure used depend on the application.
We’ll build the k-means algorithm and see it in action. We’ll next discuss some drawbacks of the simple k-means algorithm. To improve some of these problems, we can apply postprocessing to produce better clusters. Next, you’ll see a more efficient version of k-means called bisecting k-means. Finally, you’ll see an example where we’ll use bisecting k-means to find optimal parking locations while visiting multiple nightlife hotspots
10.1 The k-means clustering algorithm(k-均值聚类算法)


?k-means is an algorithm that will find k clusters for a given dataset. (k-均值是发现给定数据集的k个簇的算法)The number of clusters k is user defined .Each cluster is descirbed by a single point known as the centroid .(簇个数k是用户给定的,每一个簇通过其质心 (centroid),即簇中所有点的中心来描述。)Centroid means it's at the center of all the points in the cluster.(每个簇的质心更新为该簇所有点的平均值)
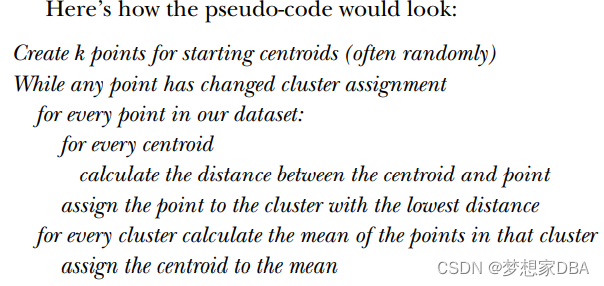
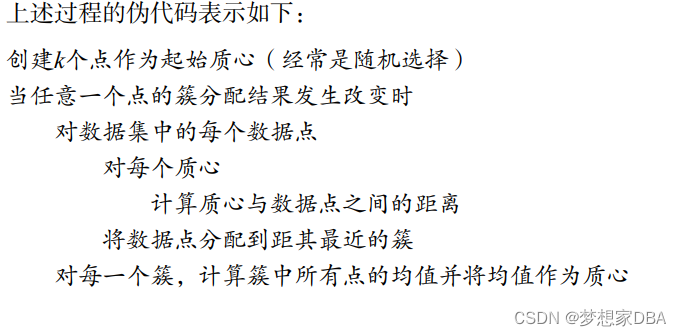
The k-means algorithm works like this:
- the k centroids are randomly assigned to a point
- each point in the dataset is assigned to a cluster. The assignment is done by finding the closest centroid and assigning the point to that cluster.
- the centroids are all updated by taking the mean value of the points in that cluster.
?
?
'''
Author: Maxwell Pan
Date: 2022-04-29 04:56:43
LastEditTime: 2022-04-29 05:56:03
FilePath: \cp010\kMeans.py
Description: Grouping unlabeled items using k-means clustering
利用K-均值聚类算法对未标注数据分组
Software:VSCode,env:
'''

# k-means support functions

import readline
import numpy as np

def loadDataSet(fileName):
    dataMat = []
    fr = open(fileName)
    for line in fr.readlines():
        curLine = line.strip().split('\t')
        fltLine = np.map(float,curLine)
        dataMat.append(fltLine)
    return dataMat
# calculates the Euclidean distance between two vectors.
def distEclud(vecA,vecB):
    return np.sqrt(sum(np.power(vecA - vecB, 2)))
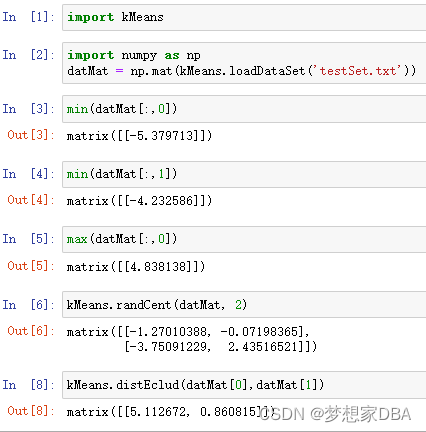
# randCent(), which creates a set of k random centroids for a given dataset.This is accomplished by finding the minimum and maximum values of each dimension in the dataset.
def randCent(dataSet, k):
    n = np.shape(dataSet)[1]
    centroids = np.mat(np.zeros((k,n)))
    for j in range(n):
        minJ = min(dataSet[:,j])
        rangeJ = float(max(dataSet[:,j]) - minJ)
        centroids[:,j] = minJ + rangeJ * np.random.rand(k,1)
    return centroids
?
def kMeans(dataSet,k,disMeas=distEclud,createCent=randCent):
    m = np.shape(dataSet)[0]
    # the cluster assignment matrix
    clusterAssment = np.mat(np.zeros(m,2))
    centroids = createCent(dataSet,k)
    # create a flag called clusterChanged,if this is True you continue iterating.
    clusterChanged = True
    # the iteration is handled by a while loop.
    while clusterChanged:
        clusterChanged = False
        for i in range(m):
            minDist = np.inf
            minIndex = -1
            for j in range(m):
                distJI = np.distMeas(centroids[j,:],dataSet[i,:])
                if distJI < minDist:
                    minDist = distJI
                    minIndex = j
            if clusterAssment[i,0] != minIndex:
                clusterChanged = True
            clusterAssment[i,0] = minIndex,minDist**2
        print(centroids)
        for cent in range(k):
            ptsInClust = dataSet[np.nonzero(clusterAssment[:,0].A==cent)[0]]
            centroids[cent,:] = np.mean(ptsInClust,axis=0)
    return centroids,clusterAssment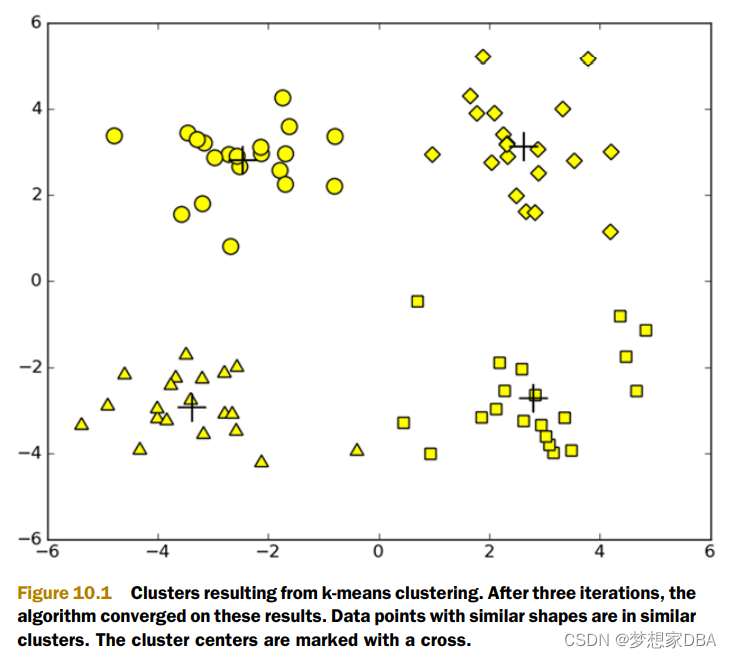
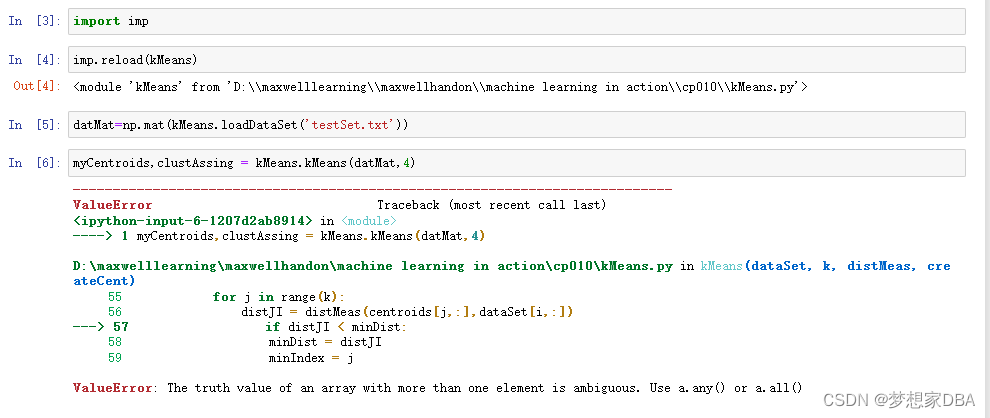
?
10.2 Improving cluster performance with postprocessing?
10.3 Bisecting k-means
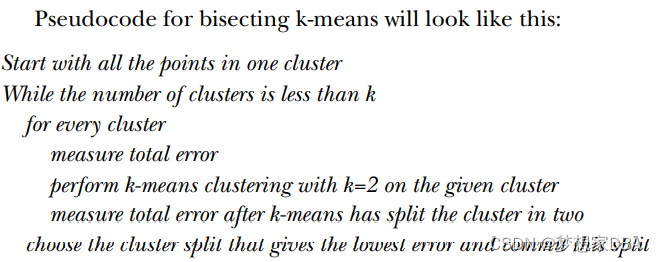
To overcome the problem of poor clusters because of k-means getting caught in local minimum, another algorithm has been developed.
?
'''
Author: Maxwell Pan
Date: 2022-04-29 04:56:43
LastEditTime: 2022-04-30 07:39:35
FilePath: \cp010\kMeans.py
Description: Grouping unlabeled items using k-means clustering
利用K-均值聚类算法对未标注数据分组
Software:VSCode,env:
'''

# k-means support functions

import numpy as np
"""
def loadDataSet(fileName):
    dataMat = []
    fr = open(fileName)
    for line in fr.readlines():
        curLine = line.strip().split('\t')
        fltLine = list(map(float,curLine)) # map all elements to float()
        dataMat.append(fltLine)
    return dataMat

# calculates the Euclidean distance between two vectors.
def distEclud(vecA,vecB):
    return np.sqrt(sum(np.power(vecA - vecB, 2)))

# randCent(), which creates a set of k random centroids for a given dataset.This is accomplished by finding the minimum and maximum values of each dimension in the dataset.
def randCent(dataSet, k):
    n = np.shape(dataSet)[1]
    centroids = np.mat(np.zeros((k,n)))
    for j in range(n):
        minJ = min(dataSet[:,j])  # create cluster centroids
        maxJ = max(dataSet[:,j])
        rangeJ = float(maxJ - minJ)
        # Create an array of the given shape and populate it with samples from a uniform distribution over (0,1)
        centroids[:,j] = minJ + rangeJ * np.random.rand(k,1)

    return centroids


def kMeans(dataSet,k,distMeas=distEclud,createCent=randCent):
    m = np.shape(dataSet)[0]
    # the cluster assignment matrix
    clusterAssment = np.mat(np.zeros((m,2)))
    centroids = createCent(dataSet,k)
    # create a flag called clusterChanged,if this is True you continue iterating.
    clusterChanged = True
    # the iteration is handled by a while loop.
    while clusterChanged:
        clusterChanged = False
        for i in range(m):
            minDist = np.inf   #pay attention
            minIndex = -1
            for j in range(k):
                distJI = distMeas(centroids[j,:],dataSet[i,:])
                if distJI < minDist:
                    minDist = distJI
                    minIndex = j

            if clusterAssment[i,0] != minIndex:
                clusterChanged = True
            clusterAssment[i,:] = minIndex,minDist**2
        print(centroids)
        for cent in range(k):
            ptsInClust = dataSet[np.nonzero(clusterAssment[:,0].A==cent)[0]]
            centroids[cent,:] = np.mean(ptsInClust,axis=0)
    return centroids,clusterAssment


def biKmeans(dataSet,k,distMeas=distEclud):
    m = np.shape(dataSet)[0]
    clusterAssment = np.mat(np.zeros((m,2)))
    centroid0 = np.mean(dataSet, axis=0).tolist()[0]
    centList = [centroid0]
    for j in range(m):
        clusterAssment[j,1] = distMeas(np.mat(centroid0), dataSet[j,:])**2
    while (len(centList) < k):
        lowestSSE = np.inf
        for i in range(len(centList)):
            ptsInCurrCluster = dataSet[np.nonzero(clusterAssment[:,0].A==i)[0],:]
            centroidMat,splitClustAss = kMeans(ptsInCurrCluster,2,distMeas)
            sseSplit = sum(splitClustAss[:,1])
            sseNotSplit = sum(clusterAssment[np.nonzero(clusterAssment[:,0].A !=i)[0],1])
            print("sseSplit, and notSplit: ",sseSplit,sseNotSplit)
            if(sseSplit + sseNotSplit) < lowestSSE:
                bestCentToSplit = i
                bestNewCents = centroidMat
                bestClustAss = splitClustAss.copy()
                lowestSSE = sseSplit + sseNotSplit
        bestClustAss[np.nonzero(bestClustAss[:,0].A == 1)[0],0] = len(centList)
        bestClustAss[np.nonzero(bestClustAss[:,0].A == 0)[0],0] = bestCentToSplit
        print("the bestCentToSplit is: ", len(bestClustAss))
        print("the len of bestClusterAss is: ",len(bestClustAss))
        centList[bestCentToSplit] = bestNewCents[0,:].tolist()[0]
        centList.append(bestNewCents[1,:].tolist()[0])
        clusterAssment[np.nonzero(clusterAssment[:,0].A == bestCentToSplit)[0],:] = bestClustAss
    return np.mat(centList), clusterAssment
"""

def loadDataSet(fileName):      #general function to parse tab -delimited floats
    dataMat = []                #assume last column is target value
    fr = open(fileName)
    for line in fr.readlines():
        curLine = line.strip().split('\t')
        fltLine = list(map(float,curLine)) #map all elements to float()
        dataMat.append(fltLine)
    return dataMat

def distEclud(vecA, vecB):
    return np.sqrt(sum(np.power(vecA - vecB, 2))) #la.norm(vecA-vecB)

def randCent(dataSet, k):
    n = np.shape(dataSet)[1]
    centroids = np.mat(np.zeros((k,n)))#create centroid mat
    for j in range(n):#create random cluster centers, within bounds of each dimension
        minJ = min(dataSet[:,j])
        rangeJ = float(max(dataSet[:,j]) - minJ)
        centroids[:,j] = np.mat(minJ + rangeJ * np.random.rand(k,1))
    return centroids

def kMeans(dataSet, k, distMeas=distEclud, createCent=randCent):
    m = np.shape(dataSet)[0]
    clusterAssment = np.mat(np.zeros((m,2)))#create mat to assign data points
                                      #to a centroid, also holds SE of each point
    centroids = createCent(dataSet, k)
    clusterChanged = True
    while clusterChanged:
        clusterChanged = False
        for i in range(m):#for each data point assign it to the closest centroid
            minDist = np.inf; minIndex = -1
            for j in range(k):
                distJI = distMeas(centroids[j,:],dataSet[i,:])
                if distJI < minDist:
                    minDist = distJI; minIndex = j
            if clusterAssment[i,0] != minIndex: clusterChanged = True
            clusterAssment[i,:] = minIndex,minDist**2
        print(centroids)
        for cent in range(k):#recalculate centroids
            ptsInClust = dataSet[np.nonzero(clusterAssment[:,0].A==cent)[0]]#get all the point in this cluster
            centroids[cent,:] = np.mean(ptsInClust, axis=0) #assign centroid to mean
    return centroids, clusterAssment

def biKmeans(dataSet, k, distMeas=distEclud):
    m = np.shape(dataSet)[0]
    clusterAssment = np.mat(np.zeros((m,2)))
    centroid0 = np.mean(dataSet, axis=0).tolist()[0]
    centList =[centroid0] #create a list with one centroid
    for j in range(m):#calc initial Error
        clusterAssment[j,1] = distMeas(np.mat(centroid0), dataSet[j,:])**2
    while (len(centList) < k):
        lowestSSE = np.inf
        for i in range(len(centList)):
            ptsInCurrCluster = dataSet[np.nonzero(clusterAssment[:,0].A==i)[0],:]#get the data points currently in cluster i
            centroidMat, splitClustAss = kMeans(ptsInCurrCluster, 2, distMeas)
            sseSplit = sum(splitClustAss[:,1])#compare the SSE to the currrent minimum
            sseNotSplit = sum(clusterAssment[np.nonzero(clusterAssment[:,0].A!=i)[0],1])
            print("sseSplit, and notSplit: ",sseSplit,sseNotSplit)
            if (sseSplit + sseNotSplit) < lowestSSE:
                bestCentToSplit = i
                bestNewCents = centroidMat
                bestClustAss = splitClustAss.copy()
                lowestSSE = sseSplit + sseNotSplit
        bestClustAss[np.nonzero(bestClustAss[:,0].A == 1)[0],0] = len(centList) #change 1 to 3,4, or whatever
        bestClustAss[np.nonzero(bestClustAss[:,0].A == 0)[0],0] = bestCentToSplit
        print('the bestCentToSplit is: ',bestCentToSplit)
        print('the len of bestClustAss is: ', len(bestClustAss))
        centList[bestCentToSplit] = bestNewCents[0,:].tolist()[0]#replace a centroid with two best centroids
        centList.append(bestNewCents[1,:].tolist()[0])
        clusterAssment[np.nonzero(clusterAssment[:,0].A == bestCentToSplit)[0],:]= bestClustAss#reassign new clusters, and SSE
    return np.mat(centList), clusterAssment

import urllib
import json
def geoGrab(stAddress, city):
    apiStem = 'http://where.yahooapis.com/geocode?'  #create a dict and constants for the goecoder
    params = {}
    params['flags'] = 'J'#JSON return type
    params['appid'] = 'aaa0VN6k'
    params['location'] = '%s %s' % (stAddress, city)
    url_params = urllib.parse.urlencode(params)
    yahooApi = apiStem + url_params      #print url_params
    print(yahooApi)
    c=urllib.request.urlopen(yahooApi)
    return json.loads(c.read())

from time import sleep
def massPlaceFind(fileName):
    fw = open('places.txt', 'w')
    for line in open(fileName).readlines():
        line = line.strip()
        lineArr = line.split('\t')
        retDict = geoGrab(lineArr[1], lineArr[2])
        if retDict['ResultSet']['Error'] == 0:
            lat = float(retDict['ResultSet']['Results'][0]['latitude'])
            lng = float(retDict['ResultSet']['Results'][0]['longitude'])
            print("%s\t%f\t%f" % (lineArr[0], lat, lng))
            fw.write('%s\t%f\t%f\n' % (line, lat, lng))
        else: print("error fetching")
        sleep(1)
    fw.close()

def distSLC(vecA, vecB):#Spherical Law of Cosines
    a = np.sin(vecA[0,1]*np.pi/180) * np.sin(vecB[0,1]*np.pi/180)
    b = np.cos(vecA[0,1]*np.pi/180) * np.cos(vecB[0,1]*np.pi/180) * \
                      np.cos(np.pi * (vecB[0,0]-vecA[0,0]) /180)
    return np.arccos(a + b)*6371.0 #pi is imported with numpy

import matplotlib
import matplotlib.pyplot as plt
def clusterClubs(numClust=5):
    datList = []
    for line in open('places.txt').readlines():
        lineArr = line.split('\t')
        datList.append([float(lineArr[4]), float(lineArr[3])])
    datMat = np.mat(datList)
    myCentroids, clustAssing = biKmeans(datMat, numClust, distMeas=distSLC)
    fig = plt.figure()
    rect=[0.1,0.1,0.8,0.8]
    scatterMarkers=['s', 'o', '^', '8', 'p', \
                    'd', 'v', 'h', '>', '<']
    axprops = dict(xticks=[], yticks=[])
    ax0=fig.add_axes(rect, label='ax0', **axprops)
    imgP = plt.imread('Portland.png')
    ax0.imshow(imgP)
    ax1=fig.add_axes(rect, label='ax1', frameon=False)
    for i in range(numClust):
        ptsInCurrCluster = datMat[np.nonzero(clustAssing[:,0].A==i)[0],:]
        markerStyle = scatterMarkers[i % len(scatterMarkers)]
        ax1.scatter(ptsInCurrCluster[:,0].flatten().A[0], ptsInCurrCluster[:,1].flatten().A[0], marker=markerStyle, s=90)
    ax1.scatter(myCentroids[:,0].flatten().A[0], myCentroids[:,1].flatten().A[0], marker='+', s=300)
    plt.show()
10.5 Summary:
Clustering is a technique used in unsupervised learning.Clustering groups data points together, with similar data points in one cluster and dissimilar points in a different group. A number of different measurements can be used to measure similarity.
One widely used clustering algorithm is k-means, where k is a user-specified number of clusters to create. The k-means clustering algorithm starts with k-random cluster centers known as centroids. Next, the algorithm computes the distance from every point to the cluster centers. Each point is assigned to the closest cluster center
k-means and its derivatives aren’t the only clustering algorithms. Another type of clustering, known as hierarchical clustering, is also a widely used clustering algorithm. In the next chapter, we’ll examine the Apriori algorithm for finding association rules in a dataset.
