- 作为性能测试工具学习的作业,也是全英文的,应该意思都能懂吧…
Brief Introduction
- KylinTOP (chinese name is 奇林测试平台) is a domestic product, containing performance testing, automatic testing, business and interface monitoring functionalities.
- KylinTOP is a distributed system structured with B/S framework, supports cross platform.
- It breaks the monopoly of foreign enterprises and makes China have a truly domestic software performance testing tool for the first time. The simulation degree, problem analysis ability and resource consumption of the performance test tool are better than those of LoadRunner in the United States. At present, it is widely used in military industry, evaluation and testing institutions, state-owned enterprises, banking system and large enterprises. There are many supported protocols, especially in the field of video, which has unique advantages.
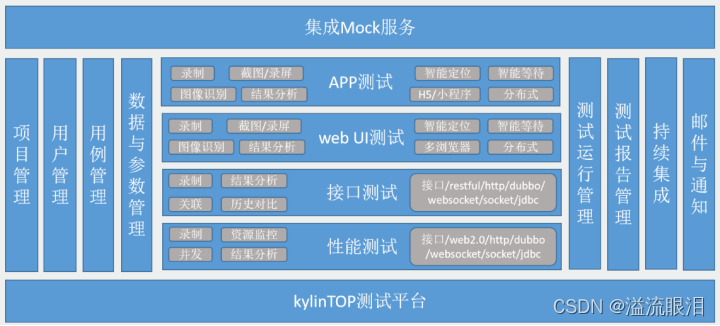
Platform Structure
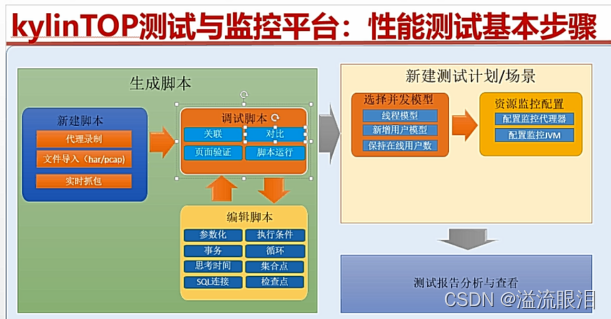
- According to the above graph, the platform structure is shown like this.

Performance Testing Feature
- Here, I will list all the mentioned features , choose some of them and explain the details.
- Simulation Capability
Simulation degree is the ability of the performance test tool to simulate the similarity between the client and the server. The higher the simulation degree, the more credible the test results. Kylintop’s protocol simulation ability can be almost the same as that of real browsers.
Compared with similar products in the industry, it has the highest simulation ability. - Both protocol simulation and client simulation are supported
Protocol simulation is to simulate the interaction behavior of the communication protocol between the client and the server, and the client simulation is a performance test tool that indirectly simulates the client sending the request protocol to the server. It is to send the request protocol to the server by driving the client interface operation. Kylintop is the only performance test tool in the industry that supports two simulation modes at the same time. - Supporting multiple protocols
- Script recording
Script recording supports four modes (browser agent, pcap packet capture file import, har file import, network card real-time packet capture, and manual creation) - Script debugging
Script debugging can view the response code, time and content comparison between playback and recording time at each step. After playback, automatic association analysis, manual Association and page verification can be carried out to ensure the correctness of script playback. - Supporting multiple concurrency models
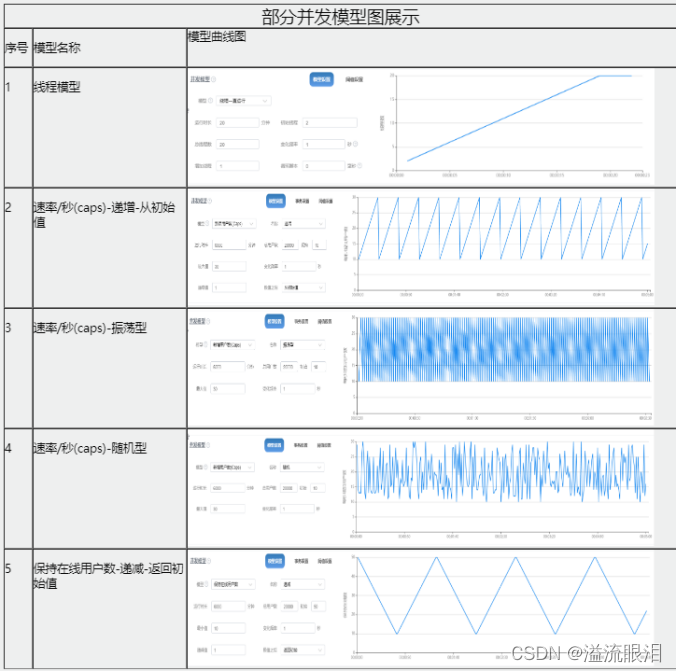
It supports three models: thread model, rate / second (CAPS) and number of online users / second, with a total of 19 concurrency model settings. It is the performance test tool that supports the most concurrency models in the industry and is suitable for a variety of different scenarios.
 - Supporting high concurrency
- Resource monitoring capability
Kylintop supports a wide range of performance indicators for monitoring, It contains almost all performance indicators that customers care about (the number of performance indicators supported for monitoring is 100 +), and support the analysis of virtual users, including request response time and transaction time, 90% and 80% of time support, the first buffer time and TCP establishment time. It can help test and developers quickly find the problems of the tested system. Through these indicators, performance problems can be accurately located, such as the first fragment time of HTTP Well distinguish between network problems and server problems. - Unmanned business monitoring
Installation
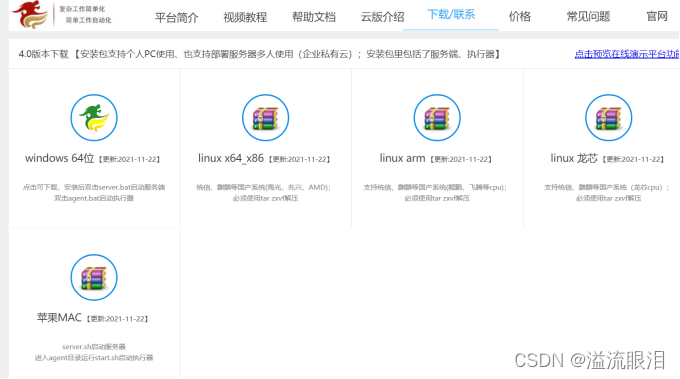
- Click this link (http://www.70testing.com/cloud/help/download.html?1639465429916), then we will go to the download web page, choose the corresponding OS version, and download the software application.

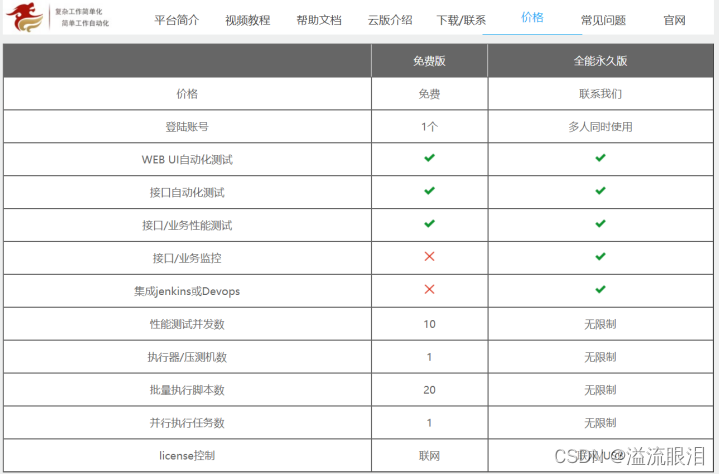
Because I use the free version, so there are several functionalities limits, see this table:

But I just want to use it as performance tester, so it’s ok for us.
After installing the software KylinTOP, it asks us to install another software winPCAP, it is used to Provide Win32 applications with the ability to access the underlying network.

Performance Testing
- This is the basic steps of performance testing.
I will do the following operations below.

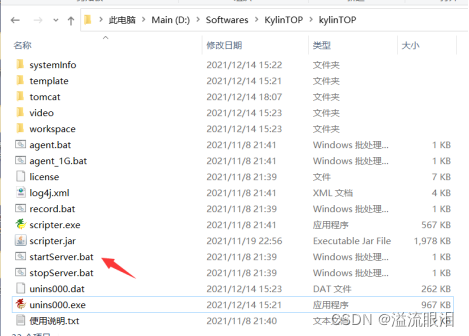
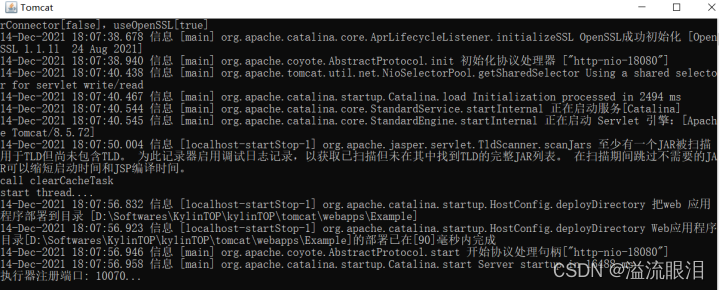
Enter the folder, run the StartServer.bat


Then, open browser, enter default IP : http://127.0.0.1:18080, but we need to login an account.

By using the default account, then we could see the panel like this.
Firstly, click “脚本用例” -> “协议/接口脚本”, and choose record http script button, click start recording

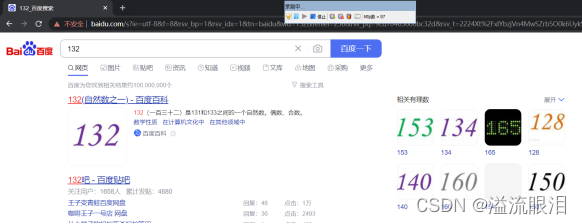
Enter the corresponding testing URL, and start to record. For example, I want to test www.baidu.com, and enter the corresponding URL like this :

Then, it records my actions and displays the http numbers.
After clicking the stop button, then the script will be added to the panel.


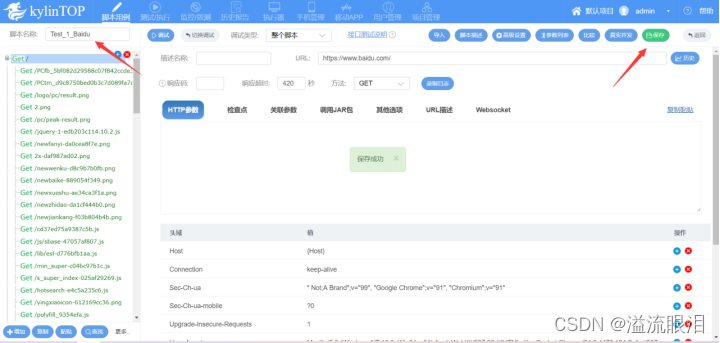
Double click the script, then we could see the details , rename it and save for the changes.

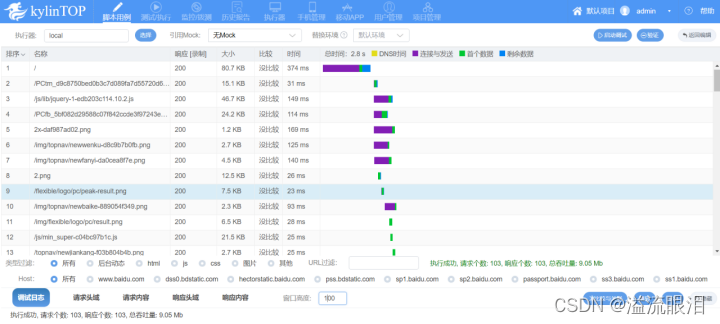
Clicking the debugging button at the middle, we will request the corresponding chosen get request, get their requests number, handling capacity and so on.
There is a flow diagram to show the concurrency situations.

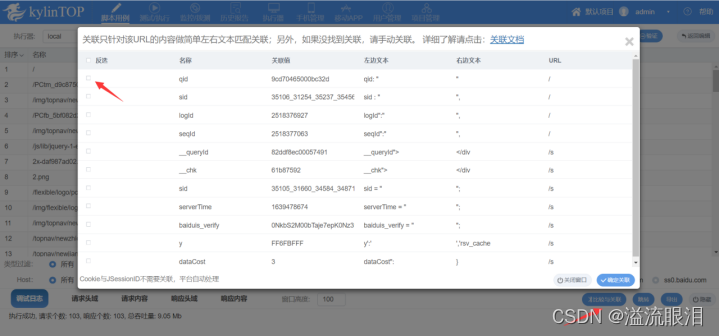
We could find the relative arguments we want to get by click the ‘Comparison And Relation’ button to get relations.

Then we get successful relations with their values about playback and record.

Go back to the script, open advanced options, choose the third executing method

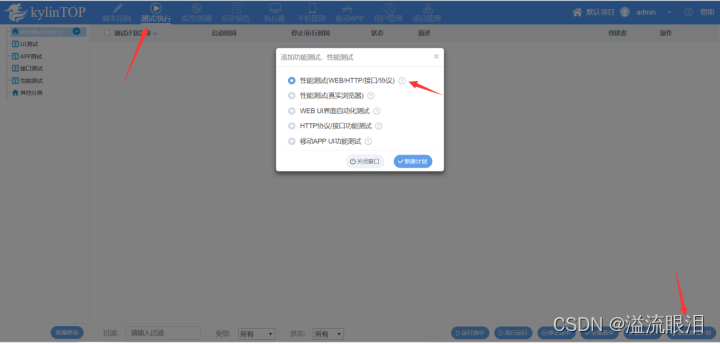
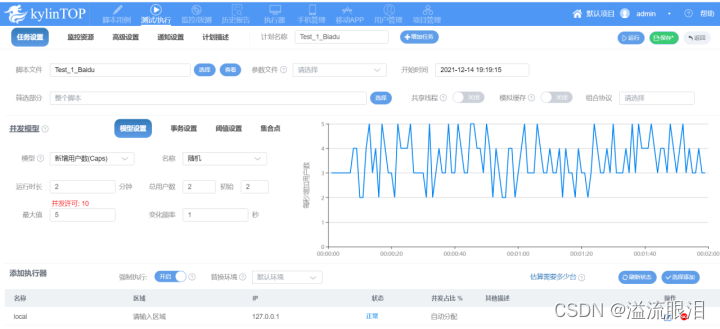
Save the changes, then go back to the Test/Execute part, click the ‘Add new testing plan’, choose performance testing(WEB/HTTP).

Enter proper arguments, add the executor, and then we could test this plan.

Go back, choose this plan, and try to run it:

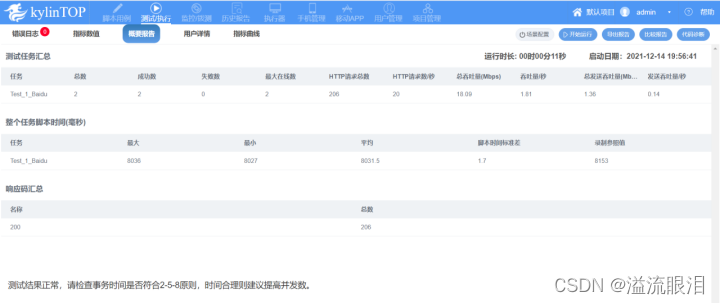
Just few second, then the logs jump out. Two tests are all fine, there are all 206 HTTP requests, we could see the running time of this script and so on.

References
- Official web page of KylinTOP : https://www.70testing.com/#/
- Introduction about KylinTOP : http://www.kylinpet.com/cloud/help/index.html
- Download web page : http://www.70testing.com/cloud/help/download.html?1639465429916
- How to test using KylinTOP : https://zhuanlan.zhihu.com/p/98650958
|
