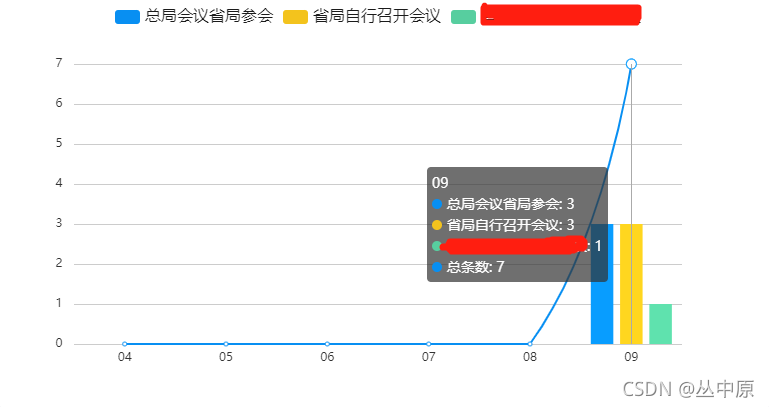
Echarts配置详情
<script src="/qlc/static/js/echarts-4.3.0/dist/echarts.min.js"></script>
1、柱状图
html代码
<span id="top_left_p" ></span>
js代码
// 基于准备好的dom,初始化echarts实例
var myChart = echarts.init(document.getElementById('top_left_p'));//柱状图
var option = {
			   title: {
			     },
			     tooltip: {
			         trigger: 'axis'
			     },
			     legend: {
			         textStyle: {//设置字体样式
			             fontSize: 16,
			             color: '#1A1A1A',
			         },
			         data: ['总局会议省局参会', '省局自行召开会议', '省委或省政府召开会议'],
			     },
			     calculable: true,
			     xAxis: [ //X轴的设置样式
			         {
			             type: 'category',
			             data: app.yuefem,
			             axisLine: { //线
			                 show: false,
			             },
			             axisTick: { //刻度
			                 show: false,
			             }
			         }
			     ],
			     yAxis: [
			         {
			             type: 'value',
			             min: 0,
			             max: app.sphyList.length,
			             axisLabel: {
			                 formatter: '{value} '
			             },
			             axisLine: {
			                 show: false,
			             },
			             axisTick: {
			                 show: false,
			             }
			         }
			     ],
			     series: [
			         {
			             name: '总局会议省局参会',
			             type: 'bar',
			             data: app.hylx_one,
			             color: ['#088FF2'],

			         },
			         {
			             name: '省局自行召开会议',
			             type: 'bar',
			             data: app.hylx_two,
			             color: ['#F3C31D'],

			         },
			         {
			             name: '省委或省政府召开会议',
			             type: 'bar',//柱状
			             data: app.hylx_three,
			             color: ['#57CE9F'],
			         },
			         {
			             name: '总条数',
			             type: 'line',  //曲线
			             data: app.hylx_all,
			             color: ['#088FF2'],
			             smooth: true,
			         },
			     ]
 };
 myChart.setOption(option);

2、堆叠图
var myChart1 = echarts.init(document.getElementById('top_right_p'));//横向柱状堆叠图
var option1 = {
		tooltip: {
		     trigger: 'axis',
		     axisPointer: {
		         type: 'shadow'
		     }
		 },
		 legend: {
		     textStyle: {
		         fontSize: 16,
		         color: '#1A1A1A',
		     },
		     data: ['总局会议省局参会', '省局自行召开会议', '省委或省政府召开会议'],
		 },
		 grid: app.grid,
		 xAxis: {
		     type: 'value',
		     axisLine: {
		         show: false,
		     },
		     axisTick: {
		         show: false,
		     },
		     axisLabel: {
		         show: false
		     },
		     splitLine:{
		         show: false
		     }
		 },
		 yAxis: {
		     type: 'category',
		     data: app.dept_yjjg,
		     left:'20%',
		       top: '80',
		     axisLine: {
		         show: false,
		     },
		     axisTick: {
		         show: false,
		     },
		     axisLabel:{
		         verticalAlign: 'bottom',
		         align:'left',
		         //调整文字上右下左
		         padding: [0,-140,15,9],
		         textStyle: {
		             fontSize: 16,
		              color: '#1A1A1A'
		         }
		     },
		 },
		 series: [
		     {
		         name: '总局会议省局参会',
		         type: 'bar',
		         stack: 'total',
		         emphasis: {
		             focus: 'series'
		         },
		         data: app.hylx_one_dept,
		         color: ['#088FF2'],
		     },
		     {
		         name: '省局自行召开会议',
		         type: 'bar',
		         stack: 'total',
		         emphasis: {
		             focus: 'series'
		         },
		         data: app.hylx_two_dept,
		         color: ['#F3C31D'],
		     },
		     {
		         name: '省委或省政府召开会议',
		         type: 'bar',
		         stack: 'total',
		         barWidth: 10,
		         barGap: '100%',
		         barCategoryGap: '100%',
		         emphasis: {
		             focus: 'series'
		         },
		         data: app.hylx_three_dept,
		         color: ['#57CE9F'],
		     }
		 ]
};
myChart1.setOption(option1);
