一、echarts的安装和引入
在vue项目中,echarts可以在全局引入挂载,也可以按需引入以减小体积
1.安装
npm install echarts -S
或者使用淘宝的镜像:
npm install -g cnpm --registry=https://registry.npm.taobao.org
cnpm install echarts -S
2.引入
import echarts from 'echarts'
Vue.prototype.$echarts = echarts

也可以按需引入:
require('echarts/lib/component/tooltip');
require('echarts/lib/component/title');
二、使用
如果是在main.js引入,挂载到prototype下,在组件中可以直接初始化dom实例,然后配置你需要的配置项,但如果项目使用echarts较多,并且很多样式是可以复用的,只需要有些配置项的变动,我建议封装一个专门的echarts.js,在需要的页面引入,然后通过传参,去改变配置项,这样会比较快捷高效。
1.挂载到main.js,创建一个简单的echarts实例
vue组件中使用,

html部分:
<div id="myCharts" :style="{width: '500px', height: '500px'}"></div>

mounted(){     //	mounted中调用初始化
	this.initEcharts()
},
methods:{
	initEcharts(){
		let myCharts = this.$echarts.init(documnet.getElementById("myCharts"))   //初始化dom实例
		myCharts.setOption({
			title: { text: 'echarts图表统计' },
       	  	tooltip: {},
        	xAxis: {
            data: ["衣服","裤子","鞋子","袜子"]
       		},
       		yAxis: {},
        	series: [{
            name: '销量',
            type: 'bar',
            data: [10, 20, 30, 40]
		})
	}
}
2.封装echarts.js,传参自定义options项
2.1首先在自己项目的工具包里新建myEcharts.js
2.2引入echarts,对echarts进行封装,以下对饼图封装的示例
import echarts from 'echarts';
require('echarts/lib/component/legend');
require('echarts/lib/component/tooltip');
require('echarts/lib/component/title');
/*** 饼图
* @param {Object} dom 节点对象
* @param {Array} data 数据
* @param {Array} colors 色彩
* @param {Object} option 配置
*/
export const pieChart = (dom,data,colors=[' '#e8774c', '#ff0000', '#749f83', '#ca8622'],option={})=>{
	require('echarts/lib/chart/pie');
	const chart = echarts.init(dom,'light')
		let defaultOption = {
	  	 	tooltip: {
  				trigger: 'item',
  				formatter: `{b}:{c}${data.unit}`,
  				color: "#ffffff"
			},
			legend: {
  				show: true, // 是否显示
  				// icon: 'circle',
 				icon: "path://M0 0 L20 0 A 20 20, 0, 0, 1, 0 20 L0 20 Z",
 				top: "bottom",
 				itemWidth: 20,
 				itemGap: 100,
 				textStyle: {
   					fontWeight: 'bold',
    				color: '#fff'
  				}
 			},
		    series: [{
		      radius: data.radius ? data.radius : ["50%", "60%"],   //内外饼的大小 ,有默认值,也可传参
		      center: data.center ? data.center : ['50%', '50%'],		//中心点
		      name: data.columns,
		      type: 'pie',
		      data: data.data,
		      // roseType: "area",
		      itemStyle: {
		      	borderRadius: 8
		      },
		      label: {
		        show: true,
		        formatter: '{c}',
		        textStyle: {
		          fontSize: 16
		        },
		      },
		      labelLine: {
		        lineStyle: {
		          type: "dasha",
		        },
		        length: 40,
		        length2: 40,
		      },
		      minAngle: 10
		    }],
			color: colors
		}
	chart.setOption(Object.assign(defaultOption, option), true);
	return chart;
}
2.3在需求的vue页面引入封装好的echarts并使用,这里以封装好的pieChart为例
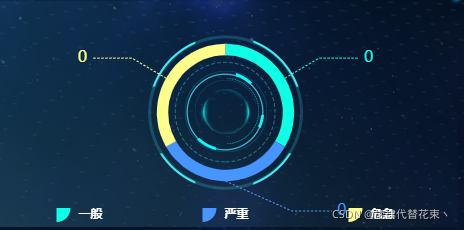
<div id="myCharts" "  ref='myCharts'></div>
JS部分:
import { pieChart } from "./utils/charts";
mounted(){
	this.getPiechart()
},
methods:{
	getPiechart(){
		this.chart1 = pieChart(
			this.$refs['myCharts'],   //第一个参数dom
			{										//第二个参数data,里面可以传入任何你可能用到的数据
				unit:“条”,
				data:[
					{name:"一般",value:0},
					{name:"严重",value:0},
					{name:"危急",value:0},
				],
				radius: ["40%", "50%"]
			},
			["#0EFFE5", "#4795FF", "#FEFF8A"],     //第三个参数colors,不传则使用默认颜色
 			{				//第四个参数,配置项
 				 legend: {
		            show: true, // 是否显示
		            icon: "circle",
		            orient: "vertical",
		            x:"center",
		            itemGap:100,
		            bottom: 20,
		            itemWidth: 10,
		            textStyle: {
		              fontWeight: "bold",
		              padding: [3, 0, 0, 0],
		              color: "#ffffff",
		            },
		        },
   			}

		);
		this.chart1.on("click",(params)=>{.........})   //可以给饼图添加一些点击事件,
														//例如点击出现弹窗,展示详细信息等
	}
}
特别的,当一个页面同时有多个echarts,容器大小发生改变,我希望自取dom的宽高,去动态绘制echarts,不至于超出或者变形,就可以给echarts绑定一个resize事件,并且去监听,有页面的拉伸,缩放等尺寸变化的行为,就自动重绘canvas
mounted(){		//挂载后,添加一个事件监听,监听resize这个方法
	    window.addEventListener("resize", this.resize);
},
methods:{
	resize(){   // resize方法,这里可以调用多个echarts的resize事件
		      this.chart1 && this.chart1.resize();
		      this.chart2 && this.chart2.resize()
		      ...
	}
},
destroyed(){     //销毁监听事件
	window.removeEventListener("resize",this.resize)
}
再插入一个背景图,做得漂亮一些,大致的效果图: