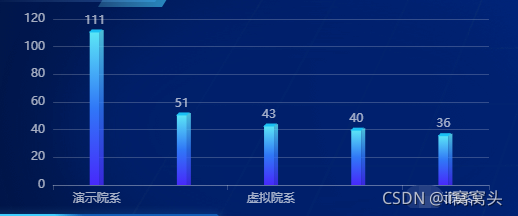
initChart() {
      this.chart = echarts.init(document.querySelector('.visit-ranking #echarts'));
      let option = {
        grid: {
          left: '3%',
          right: '4%',
          bottom: '3%',
          top: '4%',
          containLabel: true,
        },
        toolbox: {

        },
        xAxis: {
          type: 'category',
          //boundaryGap: false,
          data: this.chartData.collegeName,
          axisLabel: {
            textStyle: {
              color: 'rgba(255, 255, 255, 0.65)'
            },
          },
          axisLine: {
            lineStyle: {
              color: 'rgba(255, 255, 255, 0.2)',
            }
          }
        },
        yAxis: {
          //offset: [10, 10],
          type: 'value',
          axisLabel: {
            textStyle: {
              color: 'rgba(255, 255, 255, 0.65)'
            }
          },
          splitLine: {
            show: true,
            lineStyle: {
              color: ['rgba(255,255,255,.2)'],
              width: 1,
              type: 'solid'
            }
          }, axisLine: {
            show: false
          },
          axisTick: {
            show: false
          },
        },
        series: [
          {
            name: '教师',
            type: 'bar',
            data: this.chartData.totalNum,
            barWidth: 10,
            barGap: 200,
            barCategoryGap: 200,
            itemStyle: {
              normal: {
                color: new echarts.graphic.LinearGradient(0, 1, 0, 0, [{
                  offset: 0,
                  color: "#4729FB" // 0% 处的颜色
                }, {
                  offset: 0.5,
                  color: "#3077F7" // 50% 处的颜色
                }, {
                  offset: 1,
                  color: "#1FB0F4" // 100% 处的颜色
                }], false)
              }
            },
            label: {
              show: true, // 柱子顶部的数值
              position: 'top',
              top: 0,
              fontSize: 12,
              offset: [0, 0],
              textStyle: {
                color: 'rgba(255, 255, 255, 0.65)'
              }
            },
            itemStyle: {
              normal: {
                color: new echarts.graphic.LinearGradient(0, 1, 0, 0, [{
                  offset: 0,
                  color: "#4729FB" // 0% 处的颜色
                }, {
                  offset: 0.5,
                  color: "#3077F7" // 50% 处的颜色
                }, {
                  offset: 1,
                  color: "#5CE7F6" // 100% 处的颜色
                }], false)
              }
            },
          }, {
            type: 'bar', //右侧浅色区域,右侧边框,形成立体图形
            barWidth: 4,
            itemStyle: {
              normal: {
                color: new echarts.graphic.LinearGradient(0, 1, 0, 0, [{
                  offset: 0,
                  color: "rgba(71,41,251,.8)" // 0% 处的颜色
                }, {
                  offset: 0.5,
                  color: "rgba(48,119,247,.8)" // 50% 处的颜色
                }, {
                  offset: 1,
                  color: "rgba(92,231,246,.8)" // 100% 处的颜色
                }], false)
              }
            },
            barGap: 0,
            data: this.chartData.totalNum.map(item => item + 1)
          },
          { //顶部的矩形,封顶
            name: 'b',
            tooltip: {
              show: false
            },
            type: 'pictorialBar',
            itemStyle: {
              borderWidth: 0,
              borderColor: '#47A6FF',
              color: '#1AC0F4',

            },
            symbol: 'path://M 0,0 l 120,0 l -30,60 l -120,0 z',
            symbolSize: ['13', '3'],
            symbolOffset: ['-1', '-2'], // 左右 ,上下
            symbolRotate: 0,
            symbolPosition: 'end',
            data: this.chartData.totalNum,
            z: 3
          }
        ]
      };
      this.chart.setOption(option)
    }
?