3010������Ⱥ���ز�����Ŀ�����й�ũҵ��ѧԺ�����ѧ�о���ǣͷ,���Ϲ���ˮ���о�������������16�ҵ�λ��ͬ��ɡ����о�������89�����ҵ�3,010��ˮ��Ʒ�ֽ������ز����о�(resequence),�ο������ձ���(Nipponbare)�����顣����3,010���������ƽ���������(average sequencing depth)Ϊ14��,ƽ�������鸲����(average genome coverage)�ͻ�ͼ��(average mapping rate)�ֱ�Ϊ94.0%��92.5%��
����Ŀ��������Ȼ���ö�˵,���Ҹ���Ŀ�IJ������ݶ�����������ˮ������CNGB�����ء����ǿ��Դ�ԭʼ���п�ʼ��װ�õ���Ľṹ���� ��call��һЩϡ��SNP�����о�����Ȼ�����뷨���ڱ������۷�Χ��,������Ҫ����ֻ��֪���������������� SNP ����ֻ�ϵ����Ⱥ��ָ��ļ��㡣
2021.09.15 �����˵����ͷ��͡���ͼ�ͷ��������
����ǰ��
RFGB���Լ���̶����������ij�������ϵ�SNP&indel�͵����Ͳ��ҡ����ṩ15�����Ϳ��Խ��е����ͷ���,Ҳ�����ϴ����ͽ��з�����������̽��һ�¡�
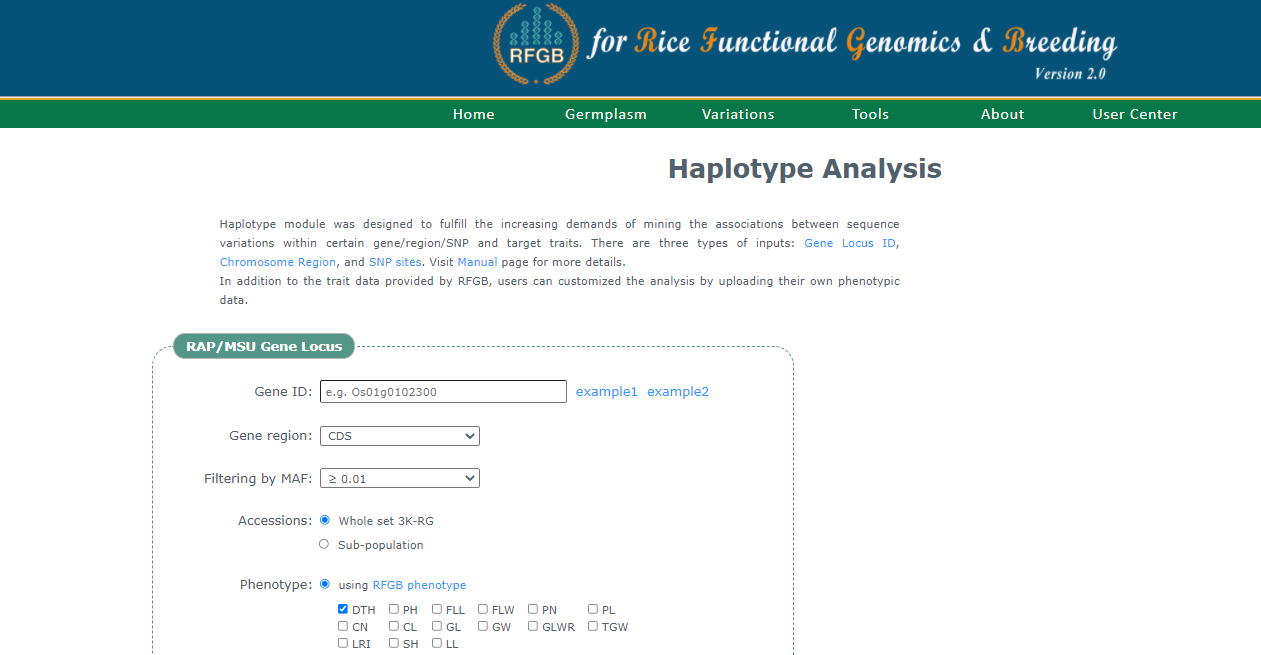
���ҳ���ṩ�����ͷ������ֱ�����û�����,Ⱦɫ��λ�ú��ض���SNP�����з������ṩMAF����С��λ����Ƶ��,����ѡһ�¡�������ȫ����3024��Ʒ�ֽ��в���Ҳ���Է���Ⱥ���в���,Ҳ�ṩ�˱�����������
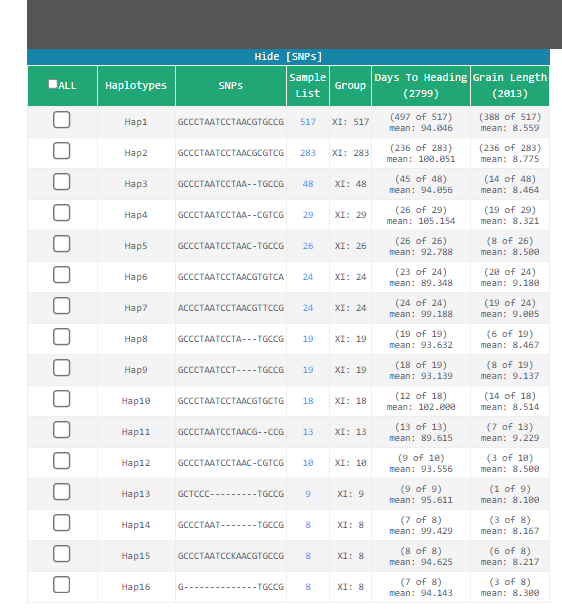

�������õ�LOC_Os08g33530 CDS ����,ѡ���̵�Ⱥ��,���ҵ�20��SNP,��16�������͡�����hap11�Ĺ�������ߡ�
�����վ�����������Ͷ���SNP,���Ǹ���λ��,����û�ҵ����������ݼ���
��ϧû��LD��ͼ��piֵ��
�����ҵ���ˮ�������͵�����,����ɿ�����
The landscape of gene�CCDS�Chaplotype diversity in rice: Properties, population organization, footprints of domestication and breeding, and implications for genetic improvement
���ݵ�ַ


Ҳ������������������ݺͱ�������������,�÷�������Ϳ��ԡ�������������
������Ҫ��3kRG������SNP��̽���Լ������á�
������
R
R package(LDheatmap,genetics)
plink1.9(3������ϵͳ�汾����)���ص�ַ
vcftools(ֻ��liunx�汾,ֻ��������Ⱥ���Ŵ�ͳ��)���ص�ַ
��������
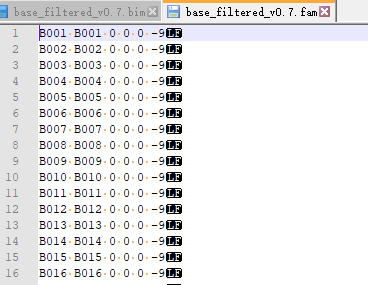
������IRRI�����ص�˫��λSNP&indel����(���λ��SNPò��ֻ�ܴ�ͷcall,û�ҵ����صĵط�)��bed��bim��fam�ļ�Ϊһ��,bed �Ǵ��λ����Ϣ�Ķ����Ƹ�ʽ�ļ�,���ı��ᷢ��������;bim�Ǵ��λ����Ϣ���ļ�,������map��ʽ;fam�Ǵ��������Ϣ���ļ�,��һ��ΪFID,�ڶ���ΪIID��

Nipponbare_indel ��˫��λindel���ݼ�,����2.3m��,������û�о���ɸѡ��,������Ҫ�ӹ��¡�
˫��λ��SNP��ǹ�5����
NB_final_snp ���������е�SNP,��29m��,��û�о���ɸѡ�ġ�
Base ��SNP�Ǿ�������ɸѡ��,��18m����
base_filtered_v0.7 �Ǵ�Base��SNP��һ��ɸѡ��,��4.2m��,������Ҫ����������ݼ���
pruned_v2.1 ��2.1�汾��ɸѡ����,����1m��SNP��
base_filtered_v0.7_0.8_10kb_1_0.8_50_1 ����base_filtered_v0.7 �Ļ����Ͻ�һ��ɸѡ �� 404k ��,���õ�ʱ���ֺܶ���������϶�û��SNP,�Ͼ�������,�Ƚ�ϡ�衣
�������ݼ���ɸѡ�������Կ�����ߵ�readme�ļ�,��ͬ��ɸѡ������ҪĿ�ľ�����߾���,�ҵ�������졣
#��Ŀ������λ��
��ʵֻ��ҪȾɫ��ź���ʼλ�þͺ���,��������дɶ����,����������ͼƬ����ġ���������,������ݼ���û���������Ҷ�����ϵı�ǡ�������ʼλ�ÿ������κ����ζ�������ȥ,���2kb,3kb ���ǿ��Ե�,���Ҽ������Ǻõ�,��һ�ͱ����������ء�
�ϲ���Ҫ��SNP���ݼ�&indel���ݼ�
��ʵ������һ�������ݼ���,�������2.3m��indel��4.2m��SNP��Ǻ���һ�����զ���ء���İ취������vcftools��bcftools�ϲ��������ݼ������Բο���ƪ��bash��������:
plink --bfile base_filtered_v0.7 --recode vcf-iid --out base_filtered_v0.7 #��ת��vcf��ʽ
plink --bfile Nipponbare_indel --recode vcf-iid --out Nipponbare_indel
###����Nipponbare_indel ����һ������ IRIS_313-8921 ������������ڹ������ķ���ΪNA,��ֵ�����Ծ���Ҫɾ����
vcftools --vcf base_filtered_v0.7.vcf --recode --recode-INFO-all --stdout --indv IRIS_313-8921 > rm_na_base_filtered_v0.7.vcf
bcftools view Nipponbare_indel.vcf -Oz -o Nipponbare_indel.vcf.gz #��������
bcftools index Nipponbare_indel.vcf.gz
bcftools view rm_na_base_filtered_v0.7.vcf -Oz -o rm_na_base_filtered_v0.7.vcf.gz
bcftools index rm_na_base_filtered_v0.7.vcf.gz
bcftools concat rm_na_base_filtered_v0.7.vcf.gz Nipponbare_indel.vcf.gz -a -O v -o combine_base_filtered_indel.vcf #�ϲ�����vcf�ļ�
plink --vcf combine_base_filtered_indel.vcf --make-bed --out combine_base_filtered_indel #��ת��bed��ʽ ��Ҫ������ռ�ڴ�С��,���vcf�ļ���55G ,bed�ļ�ֻ��5.23G
��ô�Ͳ�����vcftools�ϲ��������ݼ�զ����?��Щʱ����õ�����λ�����Ϣ,ֻ��Ҫһ���־Ϳ����ˡ���ʵ������R��plink��ʵ�ֺϲ��������ݼ�,��ֻ��ȡ����λ��,���ַ����ڴ����С��,�ҿ��������⡣
�������ļ�
Ⱥ������ļ�����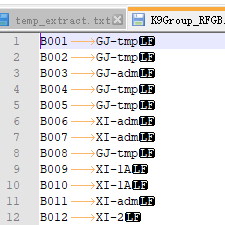
�������̫ϸ��,�����ֳ�����Ϳ�����,GJ��XI��admix��aus��bas,��excel�ķ��о������,��Ҫ��IRIS_313-8921ȥ��,���������NA����ȻҲ�������Զ���ķ��ࡣ
���ϳ�plink��ʶ��ķ����ʽ,�ֱ���FID,IID,class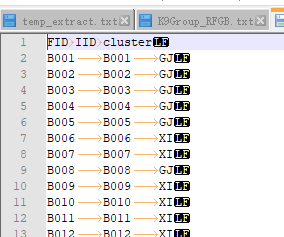
ͻȻ����ȵ���һ����,plink1.9��2��ɸѡ��ʱ����ʶ���������ƴ���"-"�ַ�,������Ҫ�� �����ļ��� ��-�����ɡ�_�� ,"IRIS_313-8921"����"IRIS_313_8921"���� excel �Ϳ������,����fam�ļ���ҲҪ����
Ŀ������SNPλ����ȡ
������Ҫ��plink.exe�ͷ����ļ�(plink_cluster.txt)�ŵ�����Ŀ¼��,�������,Ҳ�������ŵ�����Ŀ¼�¡�
R��������:
#��������
gene_list <- "C:\\Users\\jinghai\\Desktop\\dailywork\\9-2\\FTIP_gene_len.txt" #Ŀ������
out_name <- "C:\\Users\\jinghai\\Desktop\\dailywork\\9-2\\FTIP_gene" #����ļ�ǰ
data_name <- c(".\\data\\base_filtered_v0.7",".\\data\\Nipponbare_indel") #SNP���ݼ�,���������Ǻϲ�
pop_name<-c("GJ","XI","admix","aus","bas","GJ XI","admix aus bas") #��Ҫ���ɵ�Ⱥ��
fst_pop <- c("GJ XI","admix aus bas") #����fst��Ҫ��Ⱥ�� ����pop_name���ֹ�
#�ʿز���
maf <- 0.05
miss <- 0.4
color.rgb <- colorRampPalette(rev(c("white","red")),space="rgb") #color for LD
target_gene <- read.table(gene_list,header = T)
extract <- cbind(target_gene $CHROM,target_gene $start,target_gene $end,target_gene $GENE)
write.table(extract,file="temp_extract.txt",sep = "\t",append = FALSE, row.names = FALSE, col.names = FALSE, quote = FALSE)
#��ȡĿ������λ�� �����vcf�ļ� ������Tassel ��LD
#�鿴�����Ƿ�ȱ��
tem <- c()
for (i in 1:length(data_name)) {
temp <- read.table(paste0(data_name[i],".fam"),header = F)
temp <- nrow(temp)
tem <- c(tem,temp)
}
#���������������ݼ���keep
keep_file <- data_name[which(tem %in% min(tem))]
for (i in 1:length(data_name)) {
total_cmd <- paste0(".//plink --bfile ",data_name[i] ," --extract temp_extract.txt --range --keep ",paste0(keep_file,".fam")," --recode vcf-iid --out ",paste0(out_name,"_",i))
system(total_cmd,intern = FALSE)
}
temp_all <- read.table(paste0(out_name,"_",1,".vcf"),header = F,sep = '\t')
if (length(data_name)>=2){ #�ϲ����ݼ�
for (i in 2:length(data_name)) {
temp <- read.table(paste0(out_name,"_",i,".vcf"),header = F,sep = '\t')
temp_all<-rbind(temp_all ,temp )
}
temp_all<-temp_all[order(temp_all[,1],temp_all[,2]),] #����Ⱦɫ���POS����
}
### ����
fam_name<-read.table(paste0(keep_file,".fam") ,header = F,sep = ' ')[,1]
vcf_colnames<-c("#CHROM", "POS","ID","REF","ALT","QUAL","FILTER","INFO","FORMAT")
vcf_colnames<-c(vcf_colnames,fam_name)
###������,vcf
names(temp_all)<-vcf_colnames
write.table(temp_all,file=paste0(out_name,"_","target_all.vcf"),sep = "\t",append = FALSE, row.names = FALSE, col.names = T, quote = FALSE)
###ɸѡ
total_cmd <- paste0("plink --vcf ",paste0(out_name,"_","target_all.vcf")," --const-fid --maf ",maf," --geno ",miss," --make-bed --out ",paste0(out_name,"_","target_all")) #ֱ����vcfɸѡ���е�����,������ת��bed��ʽ
system(total_cmd,intern = FALSE)
temp <- read.table(paste0(out_name,"_","target_all",".fam"),header = F)
temp[,1] <- temp[,2]
write.table(temp,file=paste0(out_name,"_","target_all",".fam"),sep = " ",append = FALSE, row.names = FALSE, col.names = F, quote = FALSE)
total_cmd <- paste0(".//plink --bfile ",paste0(out_name,"_","target_all") ," --recode vcf-iid --out ",paste0(out_name,"_","target_all"))
system(total_cmd,intern = FALSE)
#��ͬȺ����ȡ ��������ȡ
for(g in target_gene$GENE){
extract <-dplyr::filter(target_gene ,GENE==g)
extract <- cbind(extract$CHROM,extract$start,extract$end,extract$GENE)
write.table(extract,file="temp_extract.txt",sep = "\t",append = FALSE, row.names = FALSE, col.names = FALSE, quote = FALSE)
total_cmd <- paste0(".\\plink --bfile ",paste0(out_name,"_","target_all")," --extract temp_extract.txt --range --recode vcf-iid --out ",paste0(out_name,"_","target_all_",g))
system(total_cmd,intern = FALSE)
total_cmd <- paste0(".\\plink --bfile ",paste0(out_name,"_","target_all")," --extract temp_extract.txt --range "," --make-bed --out ",paste0(out_name,"_","target_all_",g))
system(total_cmd,intern = FALSE)
total_cmd <- paste0(".\\plink --bfile ",paste0(out_name,"_","target_all")," --extract temp_extract.txt --range --recode HV --snps-only just-acgt --out ",paste0(out_name,"_","target_all_",g))
system(total_cmd,intern = FALSE)
for (p in pop_name) {
total_cmd <- paste0(".\\plink --bfile ",paste0(out_name,"_","target_all_",g)," --within plink_cluster.txt --keep-cluster-names ",p," --recode vcf-iid --out ",paste0(out_name,"_","target_all_",g,"_",gsub(" ","_",p)))
system(total_cmd,intern = FALSE)
total_cmd <- paste0(".\\plink --bfile ",paste0(out_name,"_","target_all_",g)," --within plink_cluster.txt --keep-cluster-names ",p," --recode HV --snps-only just-acgt --out ",paste0(out_name,"_","target_all_",g,"_",gsub(" ","_",p)))
system(total_cmd,intern = FALSE)
### total_cmd <- paste0(".\\plink --bfile ",paste0(out_name,"_","target_all_",g)," --within plink_cluster.txt --keep-cluster-names ",p," --make-bed --snps-only just-acgt --out ",paste0(out_name,"_","target_all_",g,"_",gsub(" ","_",p)))
### system(total_cmd,intern = FALSE)
}
}
for (p in pop_name) {
total_cmd <- paste0(".\\plink --bfile ",paste0(out_name,"_","target_all")," --within plink_cluster.txt --keep-cluster-names ",p," --make-bed --out ",paste0(out_name,"_","target_all_",gsub(" ","_",p)))
system(total_cmd,intern = FALSE)
}
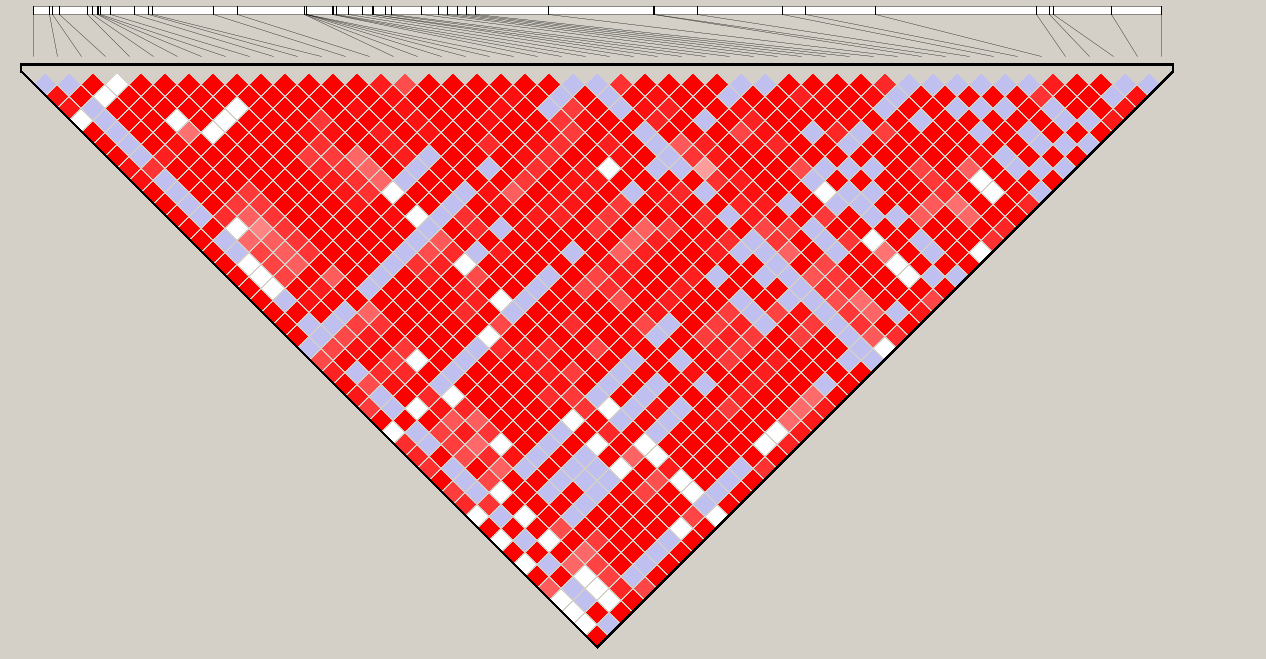
��LD heatmap
��LD��Tassel�Ϳ��Ի�,��������Ҳ������vcf��ʽ�ļ�����ֱ����Tassel�д���������LDheatmap��LDheatmap����Ľ̳̱Ƚ϶�,���ɶ�Ҳ�Ƚϸ�,��������Щ�̳�����ȻҲ�������ܻ�LDͼ��,�����е��鷳��������������ν�vcf��bed��ʽ�ļ�ת��LDheatmap���õĸ�ʽ��R��������:
library(LDheatmap)
library(genetics)
plot_LD <- function(vcf_file_name,title){
temp_vcf <- as.data.frame(data.table::fread(vcf_file_name,header = T,sep = '\t'))
if(nrow(temp_vcf )<=1) {print(paste0(vcf_file_name," have no snp&indel"));return()}###û�оͽ���
temp_snp <- temp_vcf[0,]
for (i in 1:nrow(temp_vcf)) {
temp <- temp_vcf[i,]
for(j in 10:ncol(temp_vcf)){
if(temp_vcf[i,j]=="0/0"){
temp[1,j] <- paste0(temp[1,4],"/",temp[1,4])
next
}
if(temp_vcf[i,j]=="0/1"){
temp[1,j] <- paste0(temp[1,4],"/",temp[1,5])
next
}
if(temp_vcf[i,j]=="1/1"){
temp[1,j] <- paste0(temp[1,5],"/",temp[1,5])
next
}
if(temp_vcf[i,j]=="./."){
temp[1,j] <- NA
next
}
}
temp_snp <- rbind(temp_snp,temp)
}
SNPpos <- temp_snp$POS
SNP <- as.data.frame(t(temp_snp[,10:ncol(temp_snp)]))
### ת����LDheatmap���õĸ�ʽ
for(i in 1:ncol(SNP)){
SNP[,i]<-as.genotype(SNP[,i])
}
###��ͼ
LD <- LDheatmap(SNP, SNPpos,flip=TRUE,color=color.rgb(20),title = title,SNP.name=NULL)
}
for(g in target_gene$GENE){
plot_LD(paste0(out_name,"_","target_all_",g,".vcf"),g)
for (p in pop_name) {
plot_LD(paste0(out_name,"_","target_all_",g,"_",gsub(" ","_",p),".vcf"),paste0(g,"_",gsub(" ","_",p)))
}
}

����Ⱥ���Ŵ���ָ��
�����Ƽ���vcftools������,��Ϊ���㡣��������֪����ʽ��excelҲ������,������R��plink����Fst��pi��
����Fst,Pi,Tajimi��D based on SNP vcf file
Fst���(������㲽��)
��Ⱥ���Ŵ�ѧ�� �� (pi)�ļ���

Fst
��Ҫ�ֳ���������Ⱥ�� ÿ��Ⱥ��һ���ļ�,���Է����е�5������Ⱥ��,Ҳ���Էż�������Ȥ��Ⱥ�塣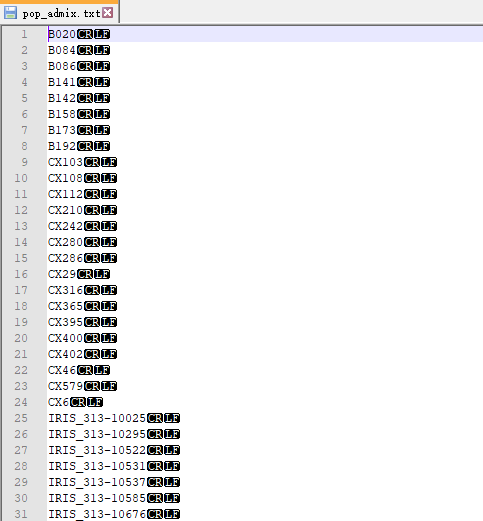
bash����
vcftools --vcf combine_base_filtered_indel.vcf --weir-fst-pop pop_GJ.txt --weir-fst-pop pop_XI.txt --weir-fst-pop pop_admix.txt --weir-fst-pop pop_aus.txt --weir-fst-pop pop_bas.txt --out combine_base_filtered_indel.fst ###������
vcftools --vcf combine_base_filtered_indel.vcf --weir-fst-pop pop_GJ.txt --weir-fst-pop pop_XI.txt --weir-fst-pop pop_admix.txt --weir-fst-pop pop_aus.txt --weir-fst-pop pop_bas.txt --fst-window-size 5000--out combine_base_filtered_indel.fst ###��windows���� ���bp
Ҳ��������plink ���㵥λ���Fst��
total_pop<-length(fst_pop)
total_cmd <- paste0(".\\plink --bfile ",paste0(out_name,"_","target_all")," --fst --within plink_cluster.txt"," --out ",paste0(out_name,"_","target_all"))
system(total_cmd,intern = FALSE)
###
for(p in fst_pop){
total_cmd <- paste0(".\\plink --bfile ",paste0(out_name,"_","target_all_",gsub(" ","_",p))," --fst --within plink_cluster.txt --keep-cluster-names ",p," --out ",paste0(out_name,"_","target_all_",gsub(" ","_",p)))
system(total_cmd,intern = FALSE)
}
temp_table<-read.table(paste0(out_name,"_","target_all",".fst"),header=T)
fst <- as.data.frame(matrix(nr=nrow(temp_table),nc=total_pop+1))
fst[,1] <- temp_table$FST
for (i in 1:total_pop) {
temp <- read.table(paste0(out_name,"_","target_all_",gsub(" ","_",fst_pop[i]),".fst"),header=T)
fst[,i+1] <- temp$FST
}
temp_all <- read.table(paste0(out_name,"_","target_all",".vcf"),header = F,sep="\t")
temp <- cbind(CHR=temp_all$V1,POS=temp_all$V2,fst)
names(temp) <- c("CHR","POS","fst",paste("fst",gsub(" ","_",fst_pop),sep = "_"))
write.table(temp,file=paste0(out_name,"_","target_all",".fst.txt"),sep = "\t",append = FALSE, row.names = FALSE, col.names = T, quote = FALSE) #������
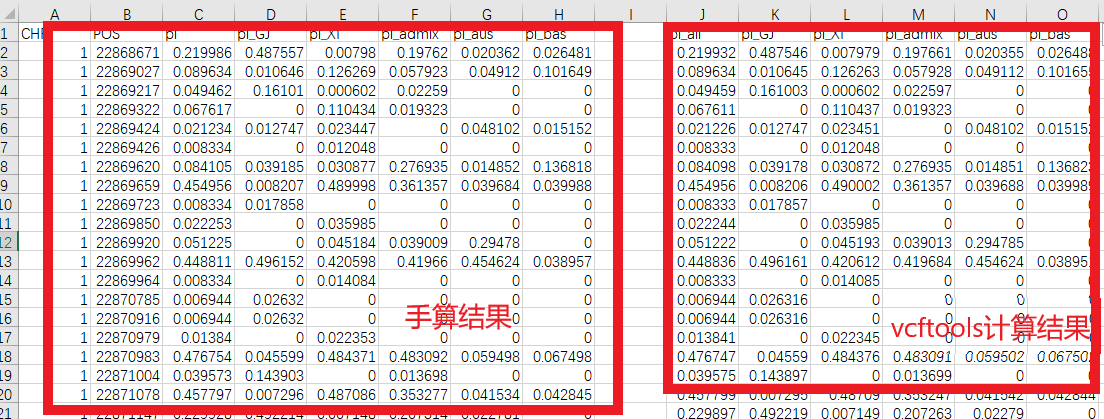
�����vcftools��һ����
pi
��vcftools���� ���Ե�λ����� Ҳ����windows ����
һ����Ϊ��windows������,����о�Ŀ����SNP,���ǵ����������
��ij������Ⱥ���м���ͼ� --keep pop_GJ.txt --keep pop_XI.txt
vcftools --vcf combine_base_filtered_indel.vcf --site-pi --out combine_base_filtered_indel.pi ###���
vcftools --vcf combine_base_filtered_indel.vcf --window-pi-step 3000 --out combine_base_filtered_indel ###3000��snpΪһ��windows
˫��λ�Ļ��� piֵ����ϼ�,�ο����������fst�Ĵ���Ϳ�����
total_pop<-length(pop_name)
total_cmd <- paste0(".\\plink --bfile ",paste0(out_name,"_","target_all")," --freq --out ",paste0(out_name,"_","target_all"))
system(total_cmd,intern = FALSE)
###
for(p in pop_name){
total_cmd <- paste0(".\\plink --bfile ",paste0(out_name,"_","target_all_",gsub(" ","_",p))," --freq --out ",paste0(out_name,"_","target_all_",gsub(" ","_",p)))
system(total_cmd,intern = FALSE)
}
temp_table<-read.table(paste0(out_name,"_","target_all",".frq"),header=T)
pi <- as.data.frame(matrix(nr=nrow(temp_table),nc=total_pop+1))
pi[,1] <- 2*temp_table$MAF*(1-temp_table$MAF)*temp_table$NCHROBS/(temp_table$NCHROBS-1)
for (j in 1:total_pop) {
temp <- read.table(paste0(out_name,"_","target_all_",gsub(" ","_",pop_name[j]),".frq"),header=T)
pi[,j+1] <- 2*temp$MAF*(1-temp$MAF)*temp$NCHROBS/(temp$NCHROBS-1)
}
temp_all <- read.table(paste0(out_name,"_","target_all",".vcf"),header = F,sep="\t")
temp <- cbind(CHR=temp_all$V1,POS=temp_all$V2,pi)
names(temp) <- c("CHR","POS","pi",paste("pi",gsub(" ","_",pop_name),sep = "_"))
write.table(temp,file=paste0(out_name,"_","target_all",".pi"),sep = "\t",append = FALSE, row.names = FALSE, col.names = T, quote = FALSE) #������
���������ͬ��
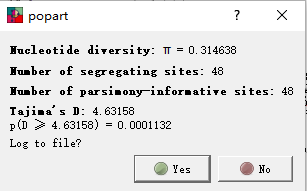
Tajima��s D ���Լ���ָ��
��ij������Ⱥ���м���ͼ� --keep pop_GJ.txt --keep pop_XI.txt
vcftools --vcf combine_base_filtered_indel.vcf --TajimaD 5000 --out combine_base_filtered_indel.TajimaD ###��5000bp����
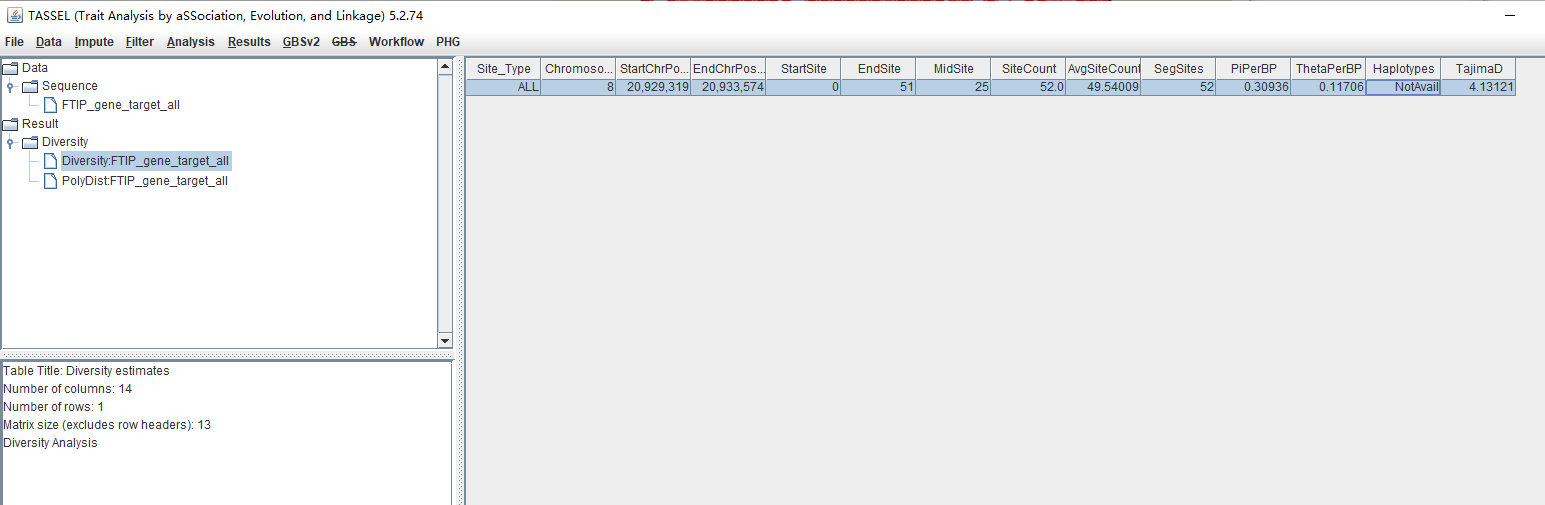
�����R�����е��鷳,������Tassel����ܷ���,��vcf����Ϳ����ˡ�
�����ͷ���
���ﶼ�õ�SNP���ݼ���,Ҳ�Ϳ��Խ��е����ͷ�����,�����õ���Haploview,Ҫ��װjava����(����֧��1.8���ϰ汾),��GUI�Ƚ��Ѻá������ʽ������plink��ʽ(ped/map)��
��Haploviewֻ����SNP�ķ���,����Ҳ����̫�ࡣ��ǰ��IJ���������ped/info �ļ�,��linkage format ����Ϳ����ˡ�
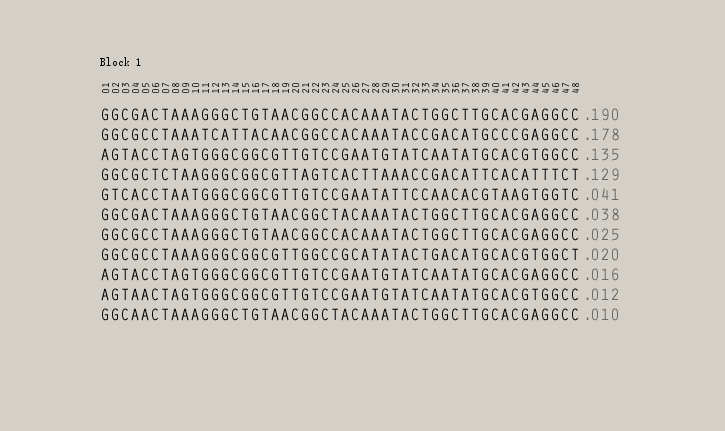
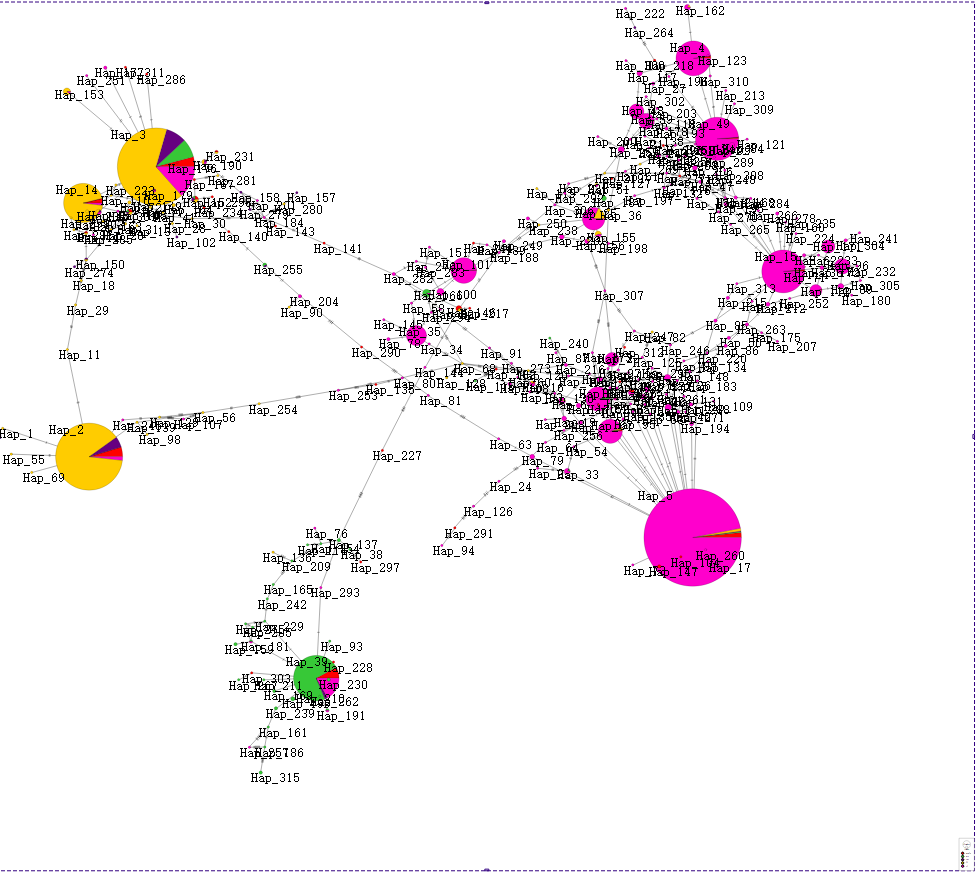
������������admixȺ���48��SNP���ɵĽ����
��������Ҫ������������ͼ,���������̫����,�����ѡ������beagle+dnasp+popart���������ͷ��ͺͻ�ͼ��
beagle:�����������ƶϺ����,��Ҫjava������
dnasp:���������ͷ���,����nex�ļ���
popart:���������ͻ�ͼ,����е�����Ϣ,Ҳ���Լ���ȥ��
���ڵ����ͷ�����������ȱʧ,������Ҫ���������,�������������vcf�ļ���Ϊ�����ļ�,���Ϊvcf.gz,��ѹ��õ���vcf�ļ����Ե��������á�����֮��vcf���"/�����Ϊ��|"����һ��ԭ����3Kˮ�������в�û��˵��bed�е�SNP�Ƕ����,����Ϊ�˱���һ�㡣
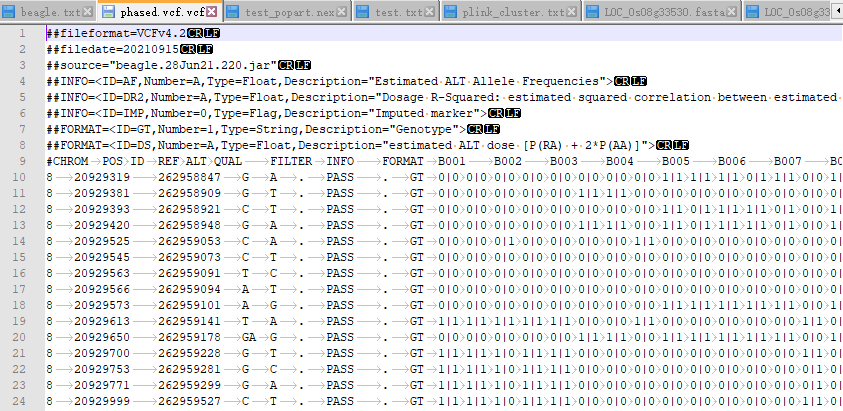
��powershell����������
# gt ����Ҫ��vcf�ļ�(������λ�÷ָ��) out ������ļ�ǰ
java -Xss5m -jar .\beagle.28Jun21.220.jar gt="C:\\Users\\jinghai\\Desktop\\dailywork\\9-2\\FTIP_gene_target_all.vcf" out=phased
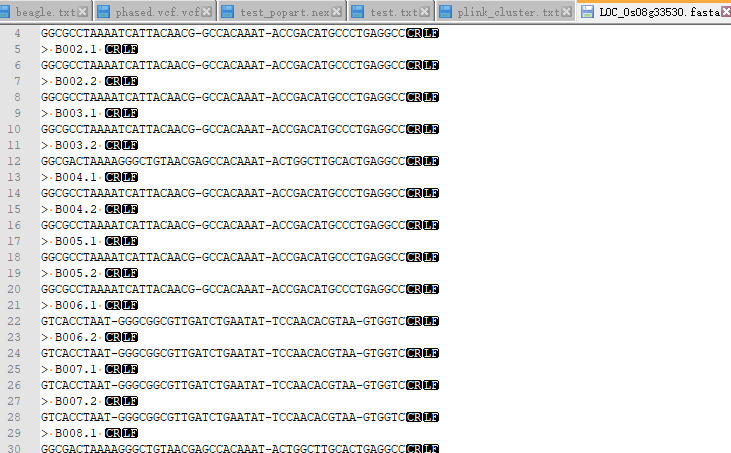
�õ�������vcf�ļ�Ȼ������fasta�ļ�,����dnasp������fasta�ļ���Ҫ�ȳ�,�������indel�ĵط�����"-"��ÿ����������������������
������R���
phase_file <- "D:\\beagle\\phased.vcf" #vcf�ļ�λ��
out_name <- "C:\\Users\\jinghai\\Desktop\\dailywork\\9-2\\FTIP_gene" #����ļ�ǰ
g <- "g" #���ǰ
vcf <- data.table::fread(phase_file,header = T)
temp <- c()
for (i in 1:nrow(vcf)) {
temp_value <- vcf[i,10:ncol(vcf)]
ref <- vcf[i,4]
alt <- vcf[i,5]
if(nchar(alt)>nchar(ref)){
alt <- substr(alt,2,nchar(alt))
ref <- paste(rep("-",nchar(alt)),collapse = "")
}
if(nchar(ref)>nchar(alt)){
ref <- substr(ref,2,nchar(ref))
alt <- paste(rep("-",nchar(ref)),collapse = "")
}
temp_value[,which(temp_value=="0|0")] <- paste(ref,ref)
temp_value[,which(temp_value=="0|1")] <- paste(ref,alt)
temp_value[,which(temp_value=="1|0")] <- paste(alt,ref)
temp_value[,which(temp_value=="1|1")] <- paste(alt,alt)
temp <- rbind(temp,temp_value)
}
temp <- as.data.frame(temp)
cat("",file=paste0(out_name,g,".fasta"),append = FALSE)
for (i in 1:ncol(temp)) {
c1 <- c()
c2 <- c()
for (j in 1:nrow(temp)) {
c1 <- c(c1,strsplit(temp[j,i]," ")[[1]][1])
c2 <- c(c2,strsplit(temp[j,i]," ")[[1]][2])
}
cat(paste(">",paste0(names(temp)[i],".1"),"\n"),file=paste0(out_name,g,".fasta"),append = TRUE)
cat(paste0(paste(c1,collapse=""),"\n"),file=paste0(out_name,g,".fasta"),append = TRUE)
cat(paste(">",paste0(names(temp)[i],".2"),"\n"),file=paste0(out_name,g,".fasta"),append = TRUE)
cat(paste0(paste(c2,collapse=""),"\n"),file=paste0(out_name,g,".fasta"),append = TRUE)
}
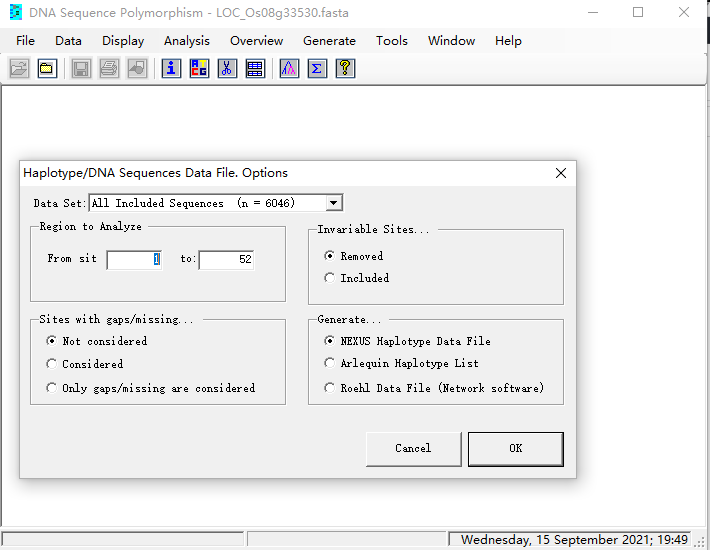
����fasta��,Generate ѡHaplotype ���ɵ�����,�õ��������ļ�(nex)

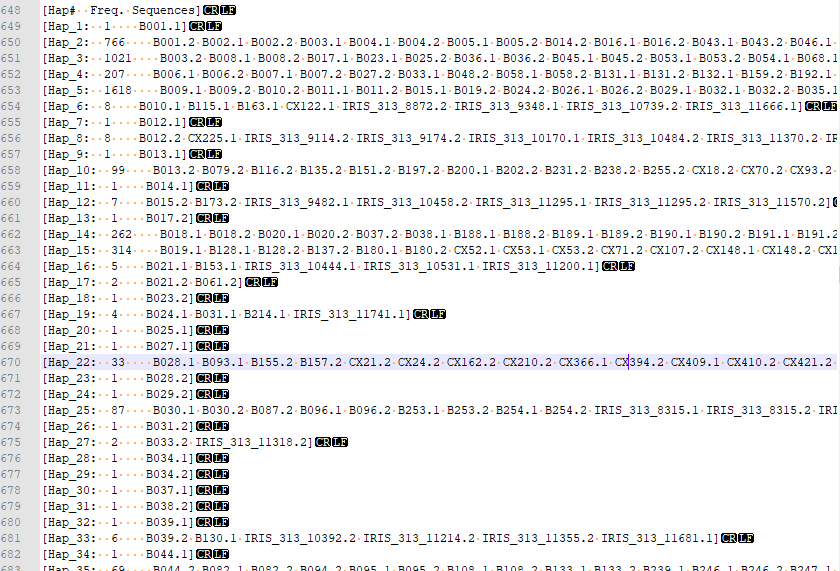
����һ���ǵõ�315��������,���ֶ�ֻ��1��������
������Ҫͳ����������Ϣ,�����nex��freq�ֶ�����Ϊtest.txt(),������ͳ��,������TraitLabels�ֶ�,������Ҫ�����ķ�����Ϣplink_cluster.txt��
clust <- read.table("plink_cluster.txt",header = T,sep = "\t")
hap <- read.table("test.txt",header = F,sep = ":")
hap[,1] <- gsub("\\[","",hap[,1])
hap[,2] <- gsub("\\]","",hap[,2])
clut_hap <- clust[,2:3]
tem <- as.data.frame(strsplit(hap[,2]," "))[2,]
hap[,3] <-t(tem)
hap[,3] <- gsub("\\.1","",hap[,3])
hap[,3] <- gsub("\\.2","",hap[,3])
for (i in 1:nrow(clust)) {
flag <- 0
v1 <- 0
v2 <- 0
for (j in 1:nrow(hap)) {
if (flag==2) break
if(clust[i,1] %in% strsplit(hap[j,3]," ")[[1]]){
idx <- which(strsplit(hap[j,3]," ")[[1]] %in% clust[i,1])
if(length(idx)==1&flag==0) {v1 <- hap[j,1];flag <- flag+1;next}
if(length(idx)==1&flag==1) {v2 <- hap[j,1];flag <- flag+1;next}
if(length(idx)==2&flag==0) {v1 <- hap[j,1];v2 <- hap[j,1];next}
}
}
clut_hap[i,3] <- v1
clut_hap[i,4] <- v2
}
write.table(clut_hap,file=paste0(out_name,g,"_clut_hap.txt"),sep = "\t",append = FALSE, row.names = FALSE, col.names = F, quote = FALSE) #������
names(clut_hap) <- c("ID","group"," "," ")
tem <- rbind(clut_hap[,c(3,2)],clut_hap[,c(4,2)])
tem <- tem[!is.na(tem[,2]),]
temp <- table(tem, exclude = 0)
out_matrix <- data.frame(matrix(temp,nrow = length(row.names(temp))))
row.names(out_matrix) <- row.names(temp)
names(out_matrix) <- gsub(" ","_",colnames(temp))
out_matrix$idx <- as.numeric(gsub("Hap_","",row.names(out_matrix)))
out_matrix <- out_matrix[order(out_matrix$idx),]
out_matrix <- out_matrix[,-ncol(out_matrix)]
cat("\n",file=paste0(out_name,g,".prenex"),append = FALSE)
cat("BEGIN TRAITS;\n",file=paste0(out_name,g,".prenex"),append = TRUE)
cat(paste0("Dimensions NTRAITS=",ncol(out_matrix),";\n"),file=paste0(out_name,g,".prenex"),append = TRUE)
cat(paste0("Format labels=yes missing=? separator=Tab",";\n"),file=paste0(out_name,g,".prenex"),append = TRUE)
cat(paste0("TraitLabels\t",paste(names(out_matrix),collapse = "\t"),";\n"),file=paste0(out_name,g,".prenex"),append = TRUE)
cat(paste0("Matrix","\n"),file=paste0(out_name,g,".prenex"),append = TRUE)
write.table(out_matrix,file=paste0(out_name,g,".prenex"),sep = "\t",append = TRUE,row.names = TRUE, col.names = F, quote = FALSE)
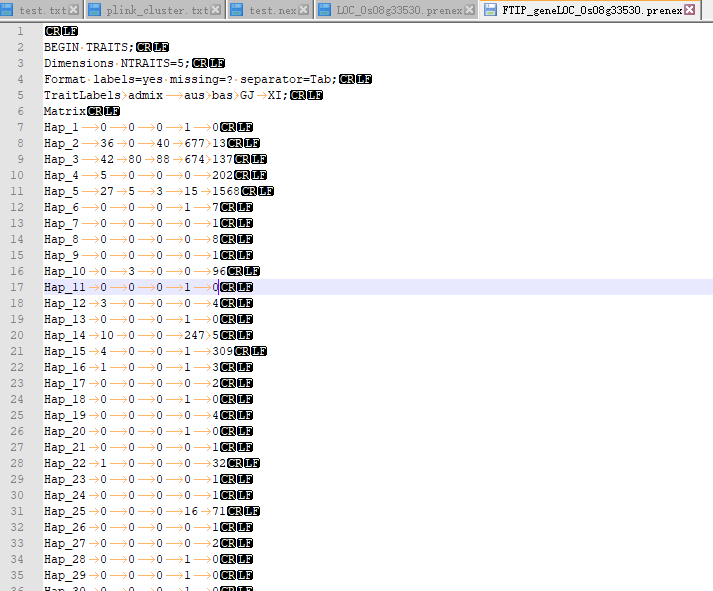
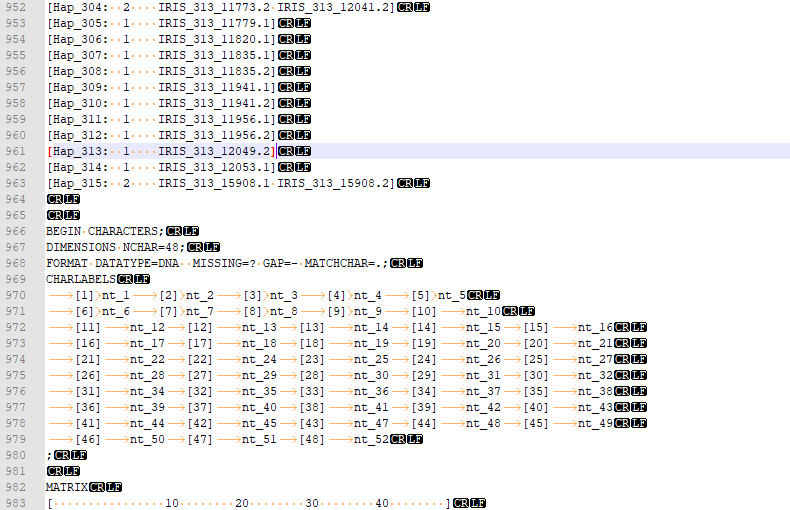
�����ɵ��ļ�ȫ����������dnasp����nex�ļ��ײ���
��������popart��ʱ��,�ļ����ǵ�����ȥ��������Ҫ��nex�ļ�ɾ��һ�Ρ�

Ȼ�����popart���ӻ��ͺ��ˡ�
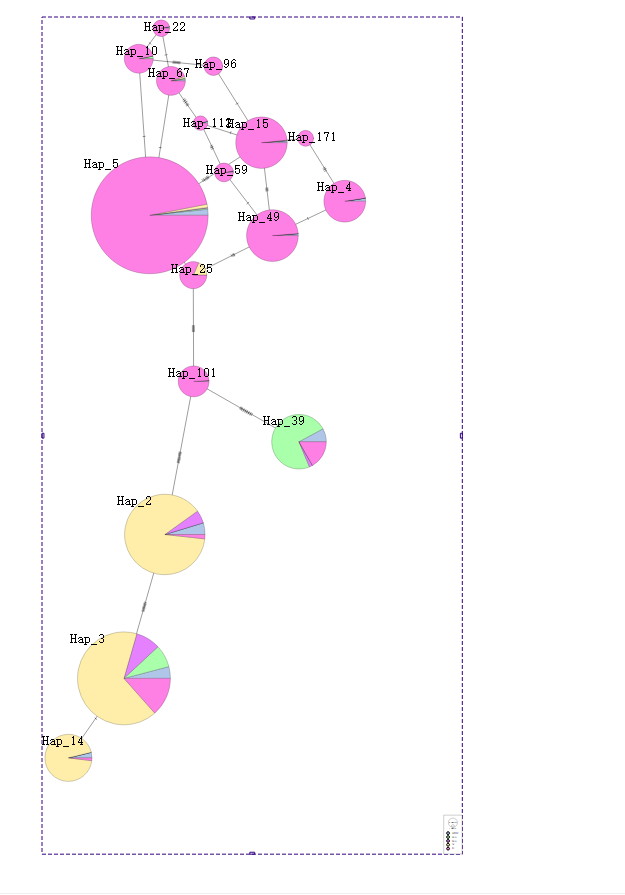
���̫����,�ֶ�ȥ����,ֻ����17��������(��TAXA,CHARACTERS,TRAITS�����ֶ�)��
Ҳ���ѷ�����Ϣ�ijɵ�����Ϣ
�ҷ���popart�����������ͻ��ϵ����Tassel��һ���ġ�
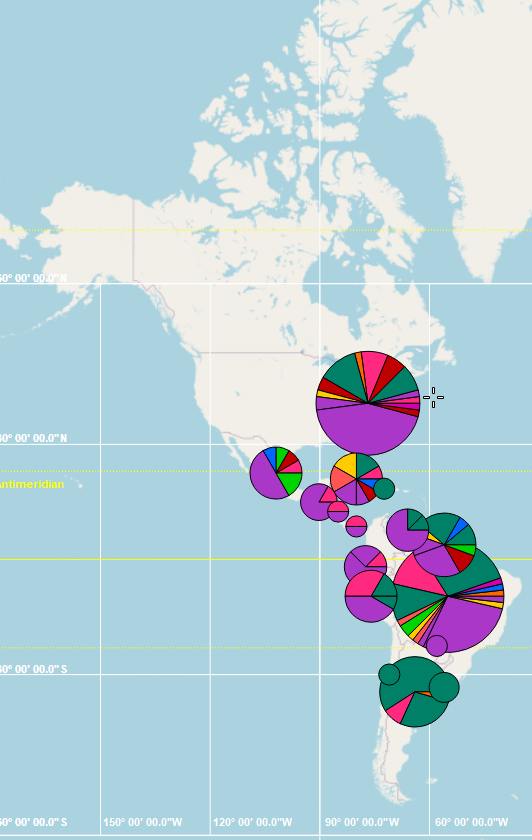
���е�������Ϣ��Ҳ˳�����·���������ˡ�
������RFGB���ص���GL������һ�¡�
�����Ĺ�������Ӧ���õ��ǻ������ģ�͡�
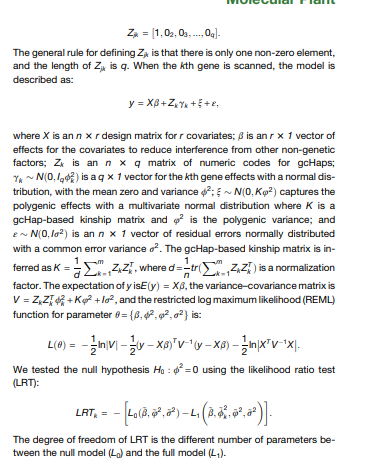
������ֻ��һ�������ϵĵ�������Ϣ,�������Э�������Ե��ϵ������ģ�ͱ临��,������Ϊ�����÷�������ȽϺ��ʡ�(�ⷽ���д���ȶ)
pheno <- read.table("grain_length.txt",header = F,sep = "\t") #�����ļ�
genotype <- read.table(paste0(out_name,g,"_clut_hap.txt"),header = F,sep = "\t") #�������ļ�
thr <- 50 #ȥ�������ٵĵ�����
tem <- merge(genotype[,c(1,4)],pheno,by=c("V1"))
colnames(tem) <- c("V1","V3","V2")
tem <- rbind(tem, merge(genotype[,c(1,3)],pheno,by=c("V1")))
tem <- merge(tem,genotype[,c(1,2)],by= c("V1"))
colnames(tem) <- c("ID","hap","pheno","cluster")
freq <- as.data.frame(table(tem$hap))
pass_filt <- as.character(freq[freq[,2]>=thr,1])
data <- tem[which(tem$hap %in% pass_filt),]
library(car)
library(agricolae)
mod <- aov(pheno~factor(hap),data) #�������
Anova(mod,type=3)
oneway.test(pheno~factor(hap),data,var.equal = F)#�����ķ������
out <- scheffe.test(mod,"factor(hap)") #�������ڷ�ƽ�����ݵĶ��رȽ�
out$groups
plot(out)

�ķ�������ɵ�hap_101�������ϳ���
#�����ܽ�
������Ҫ���ṩ��һ��������7.1m��SNP���ݼ���,��ȡ����λ��ı��,������LD��һЩȺ���Ŵ�ָ��,��������R+plink�ͽ���ˡ�
��Ȼ�����ͷ����һЩƷ�ֵ��ز�������,Ҳ���Ժ�3kˮ����SNP���ݼ��ŵ�һ����бȶ�,����������ݼ����кܶ���Ϣû�б��ھ�,���㡣
#R�������
��ȡλ��,Ⱥ��ָ�����
#��������
gene_list <- "C:\\Users\\jinghai\\Desktop\\dailywork\\9-2\\FTIP_gene_len.txt" #Ŀ������
out_name <- "C:\\Users\\jinghai\\Desktop\\dailywork\\9-2\\FTIP_gene" #����ļ�ǰ
data_name <- c(".\\data\\base_filtered_v0.7",".\\data\\Nipponbare_indel") #SNP���ݼ�,���������Ǻϲ�
pop_name<-c("GJ","XI","admix","aus","bas","GJ XI","admix aus bas") #��Ҫ���ɵ�Ⱥ��
fst_pop <- c("GJ XI","admix aus bas") #����fst��Ҫ��Ⱥ�� ����pop_name���ֹ�
#�ʿز���
maf <- 0.05
miss <- 0.4
color.rgb <- colorRampPalette(rev(c("white","red")),space="rgb") #color for LD
target_gene <- read.table(gene_list,header = T)
extract <- cbind(target_gene $CHROM,target_gene $start,target_gene $end,target_gene $GENE)
write.table(extract,file="temp_extract.txt",sep = "\t",append = FALSE, row.names = FALSE, col.names = FALSE, quote = FALSE)
###
#��ȡĿ������λ�� �����vcf�ļ� ������Tassel ��LD
#�鿴�����Ƿ�ȱ��
tem <- c()
for (i in 1:length(data_name)) {
temp <- read.table(paste0(data_name[i],".fam"),header = F)
temp <- nrow(temp)
tem <- c(tem,temp)
}
#���������������ݼ���keep
keep_file <- data_name[which(tem %in% min(tem))]
for (i in 1:length(data_name)) {
total_cmd <- paste0(".//plink --bfile ",data_name[i] ," --extract temp_extract.txt --range --keep ",paste0(keep_file,".fam")," --recode vcf-iid --out ",paste0(out_name,"_",i))
system(total_cmd,intern = FALSE)
}
temp_all <- read.table(paste0(out_name,"_",1,".vcf"),header = F,sep = '\t')
if (length(data_name)>=2){ #�ϲ����ݼ�
for (i in 2:length(data_name)) {
temp <- read.table(paste0(out_name,"_",i,".vcf"),header = F,sep = '\t')
temp_all<-rbind(temp_all ,temp )
}
temp_all<-temp_all[order(temp_all[,1],temp_all[,2]),] #����Ⱦɫ���POS����
}
### ����
fam_name<-read.table(paste0(keep_file,".fam") ,header = F,sep = ' ')[,1]
vcf_colnames<-c("#CHROM", "POS","ID","REF","ALT","QUAL","FILTER","INFO","FORMAT")
vcf_colnames<-c(vcf_colnames,fam_name)
###������,vcf
names(temp_all)<-vcf_colnames
write.table(temp_all,file=paste0(out_name,"_","target_all.vcf"),sep = "\t",append = FALSE, row.names = FALSE, col.names = T, quote = FALSE)
###ɸѡ
total_cmd <- paste0("plink --vcf ",paste0(out_name,"_","target_all.vcf")," --const-fid --maf ",maf," --geno ",miss," --make-bed --out ",paste0(out_name,"_","target_all")) #ֱ����vcfɸѡ���е�����,������ת��bed��ʽ
system(total_cmd,intern = FALSE)
temp <- read.table(paste0(out_name,"_","target_all",".fam"),header = F)
temp[,1] <- temp[,2]
write.table(temp,file=paste0(out_name,"_","target_all",".fam"),sep = " ",append = FALSE, row.names = FALSE, col.names = F, quote = FALSE)
total_cmd <- paste0(".//plink --bfile ",paste0(out_name,"_","target_all") ," --recode vcf-iid --out ",paste0(out_name,"_","target_all"))
system(total_cmd,intern = FALSE)
#��ͬȺ����ȡ ��������ȡ
for(g in target_gene$GENE){
extract <-dplyr::filter(target_gene ,GENE==g)
extract <- cbind(extract$CHROM,extract$start,extract$end,extract$GENE)
write.table(extract,file="temp_extract.txt",sep = "\t",append = FALSE, row.names = FALSE, col.names = FALSE, quote = FALSE)
total_cmd <- paste0(".\\plink --bfile ",paste0(out_name,"_","target_all")," --extract temp_extract.txt --range --recode vcf-iid --out ",paste0(out_name,"_","target_all_",g))
system(total_cmd,intern = FALSE)
total_cmd <- paste0(".\\plink --bfile ",paste0(out_name,"_","target_all")," --extract temp_extract.txt --range "," --recode --make-bed --out ",paste0(out_name,"_","target_all_",g))
system(total_cmd,intern = FALSE)
total_cmd <- paste0(".\\plink --bfile ",paste0(out_name,"_","target_all")," --extract temp_extract.txt --range --recode HV --snps-only just-acgt --out ",paste0(out_name,"_","target_all_",g))
system(total_cmd,intern = FALSE)
for (p in pop_name) {
total_cmd <- paste0(".\\plink --bfile ",paste0(out_name,"_","target_all_",g)," --within plink_cluster.txt --keep-cluster-names ",p," --recode vcf-iid --out ",paste0(out_name,"_","target_all_",g,"_",gsub(" ","_",p)))
system(total_cmd,intern = FALSE)
total_cmd <- paste0(".\\plink --bfile ",paste0(out_name,"_","target_all_",g)," --within plink_cluster.txt --keep-cluster-names ",p," --recode HV --snps-only just-acgt --out ",paste0(out_name,"_","target_all_",g,"_",gsub(" ","_",p)))
system(total_cmd,intern = FALSE)
### total_cmd <- paste0(".\\plink --bfile ",paste0(out_name,"_","target_all_",g)," --within plink_cluster.txt --keep-cluster-names ",p," --recode --make-bed --out ",paste0(out_name,"_","target_all_",g,"_",gsub(" ","_",p)))
### system(total_cmd,intern = FALSE)
}
}
for (p in pop_name) {
total_cmd <- paste0(".\\plink --bfile ",paste0(out_name,"_","target_all")," --within plink_cluster.txt --keep-cluster-names ",p," --make-bed --out ",paste0(out_name,"_","target_all_",gsub(" ","_",p)))
system(total_cmd,intern = FALSE)
}
###
library(LDheatmap)
library(genetics)
plot_LD <- function(vcf_file_name,title){
temp_vcf <- as.data.frame(data.table::fread(vcf_file_name,header = T,sep = '\t'))
if(nrow(temp_vcf )<=1) {print(paste0(vcf_file_name," have no snp&indel"));return()}###û�оͽ���
temp_snp <- temp_vcf[0,]
for (i in 1:nrow(temp_vcf)) {
temp <- temp_vcf[i,]
for(j in 10:ncol(temp_vcf)){
if(temp_vcf[i,j]=="0/0"){
temp[1,j] <- paste0(temp[1,4],"/",temp[1,4])
next
}
if(temp_vcf[i,j]=="0/1"){
temp[1,j] <- paste0(temp[1,4],"/",temp[1,5])
next
}
if(temp_vcf[i,j]=="1/1"){
temp[1,j] <- paste0(temp[1,5],"/",temp[1,5])
next
}
if(temp_vcf[i,j]=="./."){
temp[1,j] <- NA
next
}
}
temp_snp <- rbind(temp_snp,temp)
}
SNPpos <- temp_snp$POS
SNP <- as.data.frame(t(temp_snp[,10:ncol(temp_snp)]))
### ת����LDheatmap���õĸ�ʽ
for(i in 1:ncol(SNP)){
SNP[,i]<-as.genotype(SNP[,i])
}
###��ͼ
LD <- LDheatmap(SNP, SNPpos,flip=TRUE,color=color.rgb(20),title = title,SNP.name=NULL)
}
for(g in target_gene$GENE){
plot_LD(paste0(out_name,"_","target_all_",g,".vcf"),g)
for (p in pop_name) {
plot_LD(paste0(out_name,"_","target_all_",g,"_",gsub(" ","_",p),".vcf"),paste0(g,"_",gsub(" ","_",p)))
}
}
###
total_pop<-length(fst_pop)
total_cmd <- paste0(".\\plink --bfile ",paste0(out_name,"_","target_all")," --fst --within plink_cluster.txt"," --out ",paste0(out_name,"_","target_all"))
system(total_cmd,intern = FALSE)
###
for(p in fst_pop){
total_cmd <- paste0(".\\plink --bfile ",paste0(out_name,"_","target_all_",gsub(" ","_",p))," --fst --within plink_cluster.txt --keep-cluster-names ",p," --out ",paste0(out_name,"_","target_all_",gsub(" ","_",p)))
system(total_cmd,intern = FALSE)
}
temp_table<-read.table(paste0(out_name,"_","target_all",".fst"),header=T)
fst <- as.data.frame(matrix(nr=nrow(temp_table),nc=total_pop+1))
fst[,1] <- temp_table$FST
for (i in 1:total_pop) {
temp <- read.table(paste0(out_name,"_","target_all_",gsub(" ","_",fst_pop[i]),".fst"),header=T)
fst[,i+1] <- temp$FST
}
temp_all <- read.table(paste0(out_name,"_","target_all",".vcf"),header = F,sep="\t")
temp <- cbind(CHR=temp_all$V1,POS=temp_all$V2,fst)
names(temp) <- c("CHR","POS","fst",paste("fst",gsub(" ","_",fst_pop),sep = "_"))
write.table(temp,file=paste0(out_name,"_","target_all",".fst.txt"),sep = "\t",append = FALSE, row.names = FALSE, col.names = T, quote = FALSE) #������
###
total_pop<-length(pop_name)
total_cmd <- paste0(".\\plink --bfile ",paste0(out_name,"_","target_all")," --freq --out ",paste0(out_name,"_","target_all"))
system(total_cmd,intern = FALSE)
###
for(p in pop_name){
total_cmd <- paste0(".\\plink --bfile ",paste0(out_name,"_","target_all_",gsub(" ","_",p))," --freq --out ",paste0(out_name,"_","target_all_",gsub(" ","_",p)))
system(total_cmd,intern = FALSE)
}
temp_table<-read.table(paste0(out_name,"_","target_all",".frq"),header=T)
pi <- as.data.frame(matrix(nr=nrow(temp_table),nc=total_pop+1))
pi[,1] <- 2*temp_table$MAF*(1-temp_table$MAF)*temp_table$NCHROBS/(temp_table$NCHROBS-1)
for (j in 1:total_pop) {
temp <- read.table(paste0(out_name,"_","target_all_",gsub(" ","_",pop_name[j]),".frq"),header=T)
pi[,j+1] <- 2*temp$MAF*(1-temp$MAF)*temp$NCHROBS/(temp$NCHROBS-1)
}
temp_all <- read.table(paste0(out_name,"_","target_all",".vcf"),header = F,sep="\t")
temp <- cbind(CHR=temp_all$V1,POS=temp_all$V2,pi)
names(temp) <- c("CHR","POS","pi",paste("pi",gsub(" ","_",pop_name),sep = "_"))
write.table(temp,file=paste0(out_name,"_","target_all",".pi"),sep = "\t",append = FALSE, row.names = FALSE, col.names = T, quote = FALSE) #������
###
vcf to fasta
phase_file <- "D:\\beagle\\phased.vcf.vcf"
g <- g

vcf <- data.table::fread(phase_file,header = T)

temp <- c()
for (i in 1:nrow(vcf)) {
    temp_value <- vcf[i,10:ncol(vcf)]
    ref <- vcf[i,4]
    alt <- vcf[i,5]
    if(nchar(alt)>nchar(ref)){
    alt <- substr(alt,2,nchar(alt))
    ref <- paste(rep("-",nchar(alt)),collapse = "")
    }
    if(nchar(ref)>nchar(alt)){
        ref <- substr(ref,2,nchar(ref))
        alt <- paste(rep("-",nchar(ref)),collapse = "")
    }
    temp_value[,which(temp_value=="0|0")] <- paste(ref,ref)
    temp_value[,which(temp_value=="0|1")] <- paste(ref,alt)
    temp_value[,which(temp_value=="1|0")] <- paste(alt,ref)
    temp_value[,which(temp_value=="1|1")] <- paste(alt,alt)
    temp <- rbind(temp,temp_value)
}
temp <- as.data.frame(temp)

cat("",file=paste0(out_name,g,".fasta"),append = FALSE)

for (i in 1:ncol(temp)) {
    c1 <- c()
    c2 <- c()
    for (j in 1:nrow(temp)) {
        c1 <- c(c1,strsplit(temp[j,i]," ")[[1]][1])
        c2 <- c(c2,strsplit(temp[j,i]," ")[[1]][2])
    }
    cat(paste(">",paste0(names(temp)[i],".1"),"\n"),file=paste0(out_name,g,".fasta"),append = TRUE)
    cat(paste0(paste(c1,collapse=""),"\n"),file=paste0(out_name,g,".fasta"),append = TRUE)
    cat(paste(">",paste0(names(temp)[i],".2"),"\n"),file=paste0(out_name,g,".fasta"),append = TRUE)
    cat(paste0(paste(c2,collapse=""),"\n"),file=paste0(out_name,g,".fasta"),append = TRUE)
}
nex traits �ļ�����
clust <- read.table("plink_cluster.txt",header = T,sep = "\t")
hap <- read.table("test.txt",header = F,sep = ":")
hap[,1] <- gsub("\\[","",hap[,1])
hap[,2] <- gsub("\\]","",hap[,2])
clut_hap <- clust[,2:3]
tem <- as.data.frame(strsplit(hap[,2]," "))[2,]
hap[,3] <-t(tem)
hap[,3] <- gsub("\\.1","",hap[,3])
hap[,3] <- gsub("\\.2","",hap[,3])
for (i in 1:nrow(clust)) {
flag <- 0
v1 <- 0
v2 <- 0
for (j in 1:nrow(hap)) {
if (flag==2) break
if(clust[i,1] %in% strsplit(hap[j,3]," ")[[1]]){
idx <- which(strsplit(hap[j,3]," ")[[1]] %in% clust[i,1])
if(length(idx)==1&flag==0) {v1 <- hap[j,1];flag <- flag+1;next}
if(length(idx)==1&flag==1) {v2 <- hap[j,1];flag <- flag+1;next}
if(length(idx)==2&flag==0) {v1 <- hap[j,1];v2 <- hap[j,1];next}
}
}
clut_hap[i,3] <- v1
clut_hap[i,4] <- v2
}
write.table(clut_hap,file=paste0(out_name,g,"_clut_hap.txt"),sep = "\t",append = FALSE, row.names = FALSE, col.names = F, quote = FALSE) #������
names(clut_hap) <- c("ID","group"," "," ")
tem <- rbind(clut_hap[,c(3,2)],clut_hap[,c(4,2)])
tem <- tem[!is.na(tem[,2]),]
temp <- table(tem, exclude = 0)
out_matrix <- data.frame(matrix(temp,nrow = length(row.names(temp))))
row.names(out_matrix) <- row.names(temp)
names(out_matrix) <- gsub(" ","_",colnames(temp))
out_matrix$idx <- as.numeric(gsub("Hap_","",row.names(out_matrix)))
out_matrix <- out_matrix[order(out_matrix$idx),]
out_matrix <- out_matrix[,-ncol(out_matrix)]
cat("\n",file=paste0(out_name,g,".prenex"),append = FALSE)
cat("BEGIN TRAITS;\n",file=paste0(out_name,g,".prenex"),append = TRUE)
cat(paste0("Dimensions NTRAITS=",ncol(out_matrix),";\n"),file=paste0(out_name,g,".prenex"),append = TRUE)
cat(paste0("Format labels=yes missing=? separator=Tab",";\n"),file=paste0(out_name,g,".prenex"),append = TRUE)
cat(paste0("TraitLabels\t",paste(names(out_matrix),collapse = "\t"),";\n"),file=paste0(out_name,g,".prenex"),append = TRUE)
cat(paste0("Matrix","\n"),file=paste0(out_name,g,".prenex"),append = TRUE)
write.table(out_matrix,file=paste0(out_name,g,".prenex"),sep = "\t",append = TRUE,row.names = TRUE, col.names = F, quote = FALSE)
�������
pheno <- read.table("grain_length.txt",header = F,sep = "\t")
genotype <- read.table(paste0(out_name,g,"_clut_hap.txt"),header = F,sep = "\t")
thr <- 50
tem <- merge(genotype[,c(1,4)],pheno,by=c("V1"))
colnames(tem) <- c("V1","V3","V2")
tem <- rbind(tem, merge(genotype[,c(1,3)],pheno,by=c("V1")))
tem <- merge(tem,genotype[,c(1,2)],by= c("V1"))
colnames(tem) <- c("ID","hap","pheno","cluster")
freq <- as.data.frame(table(tem$hap))
pass_filt <- as.character(freq[freq[,2]>=thr,1])
data <- tem[which(tem$hap %in% pass_filt),]
library(car)
library(agricolae)
mod <- aov(pheno~factor(hap),data)
Anova(mod,type=3)
oneway.test(pheno~factor(hap),data,var.equal = F)
out <- scheffe.test(mod,"factor(hap)") #�������ڷ�ƽ�����ݵĶ��رȽ�
out$groups
plot(out)