目录
说明
在UE4中嵌入Web页面,使用WebUI插件加载Web页面并需要支持透明穿透与通信
WebUI插件
Github链接![]() http://xn--github-nb9l8373a/
http://xn--github-nb9l8373a/
ECharts
使用方法
下载插件
WebUI-4.26.zip https://github.com/tracerinteractive/UnrealEngine/releases/download/4.26.0/WebUI-4.26.zipJsonLibrary-4.26.zip
 https://github.com/tracerinteractive/UnrealEngine/releases/download/4.26.0/JsonLibrary-4.26.zipHttpLibrary-4.26.zip
 https://github.com/tracerinteractive/UnrealEngine/releases/download/4.26.0/HttpLibrary-4.26.zip插件加载
1. 把下载的插件拷贝到UE4项目的Plugins目录下
- [YourProject]
????????- Plugins
????????????????- HttpLibrary(非必须)
????????????????- JsonLibrary(必须)
????????????????- WebUI(必须)
????????- YourProject.uproject
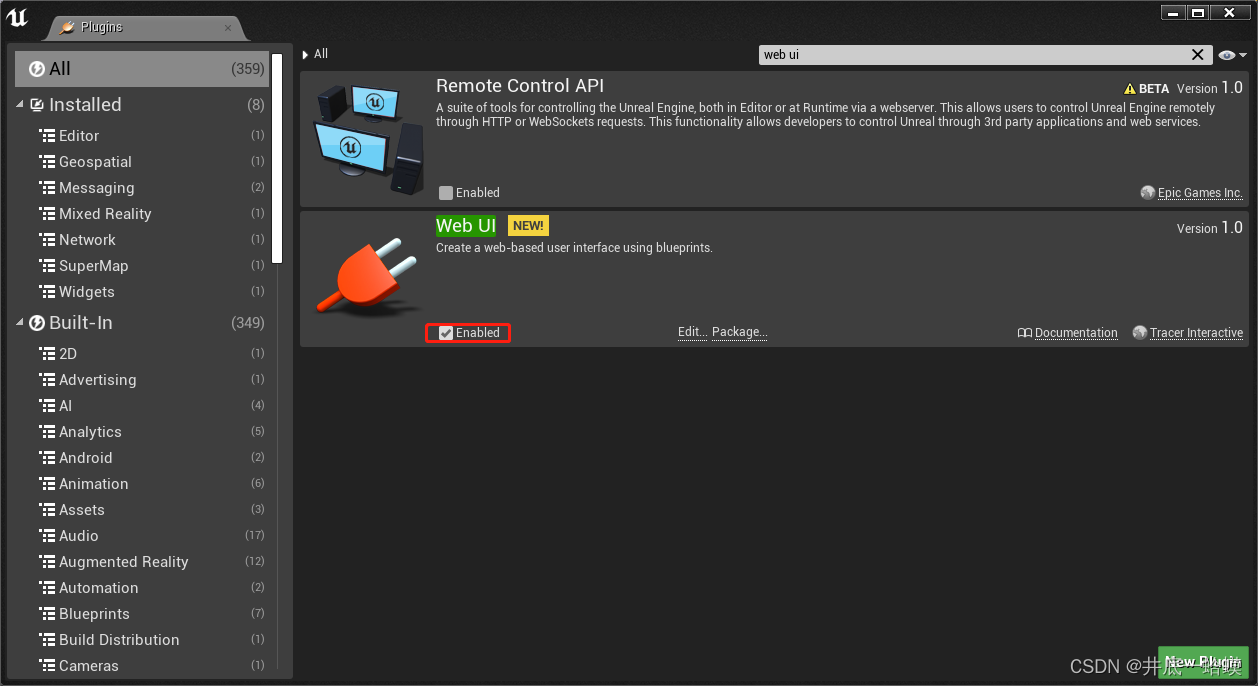
2. 打开UE4项目,并确保WebUI已加载

创建控件
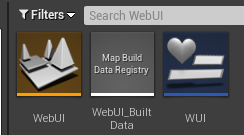
创建UMG取名WUI,并添加WebInterface控件,Anchors全屏


页面加载与通信
在关卡蓝图中创建WUI,并连接逻辑

HTML文件
- [YourProject]
????????- Content
????????????????- HTML (必须)
? ? ? ? ? ? ? ? ? ? ? ? -echarts.js
? ? ? ? ? ? ? ? ? ? ? ? -Test.html
????????- YourProject.uproject
1. echarts.jsecharts.js at 5.2.2![]() https://github.com/apache/echarts/blob/5.2.2/dist/echarts.js
https://github.com/apache/echarts/blob/5.2.2/dist/echarts.js
2. Test.html
<!DOCTYPE html>
<html>
  <head>
    <meta charset="utf-8" />
    <title>ECharts</title>
	<script>
	// create the global ue4(...) helper function
	"object"!=typeof ue&&(ue={}),uuidv4=function(){return"10000000-1000-4000-8000-100000000000".replace(/[018]/g,function(t){return(t^crypto.getRandomValues(new Uint8Array(1))[0]&15>>t/4).toString(16)})},ue4=function(r){return"object"!=typeof ue.interface||"function"!=typeof ue.interface.broadcast?(ue.interface={},function(t,e,n,o){var u,i;"string"==typeof t&&("function"==typeof e&&(o=n,n=e,e=null),u=[t,"",r(n,o)],void 0!==e&&(u[1]=e),i=encodeURIComponent(JSON.stringify(u)),"object"==typeof history&&"function"==typeof history.pushState?(history.pushState({},"","#"+i),history.pushState({},"","#"+encodeURIComponent("[]"))):(document.location.hash=i,document.location.hash=encodeURIComponent("[]")))}):(i=ue.interface,ue.interface={},function(t,e,n,o){var u;"string"==typeof t&&("function"==typeof e&&(o=n,n=e,e=null),u=r(n,o),void 0!==e?i.broadcast(t,JSON.stringify(e),u):i.broadcast(t,"",u))});var i}(function(t,e){if("function"!=typeof t)return"";var n=uuidv4();return ue.interface[n]=t,setTimeout(function(){delete ue.interface[n]},1e3*Math.max(1,parseInt(e)||0)),n});
	</script>
    <!-- 引入刚刚下载的 ECharts 文件 -->
    <script src="echarts.js"></script>
	<script src="https://code.jquery.com/jquery-2.2.4.min.js"></script>

  </head>
  <body>
    <!-- 为 ECharts 准备一个定义了宽高的 DOM -->
	<button id="btn_Print" onclick="Print()"> Print </button>
	<button id="btn_Version" onclick="Version()"> GetVersion </button>
	<p id="fpsMeter">0 FPS</p>
    <div id="main" style="width: 600px;height:400px;"></div>
    <script type="text/javascript">
      // 基于准备好的dom,初始化echarts实例
      var myChart = echarts.init(document.getElementById('main'));

      // 指定图表的配置项和数据
      var option = {
        title: {
          text: 'ECharts 入门示例'
        },
        tooltip: {},
        legend: {
          data: ['销量']
        },
        xAxis: {
          data: ['衬衫', '羊毛衫', '雪纺衫', '裤子', '高跟鞋', '袜子']
        },
        yAxis: {},
        series: [
          {
            name: '销量',
            type: 'bar',
            data: [5, 20, 36, 10, 10, 20]
          }
        ]
      };

      // 使用刚指定的配置项和数据显示图表。
      myChart.setOption(option);

	  // web端发送print事件给ue4,ue4打印msg
	  function Print()
	  {
		let msg = 'Hello World';
		ue4("print", msg);
	  }

	  // web端发送version事件给ue4,ue4打印msg并回调发送ue4引擎版本号给web端
	  function Version()
	  {
		let msg = 'version:1.0';
		ue4("version", msg, function(v){
			// 收到ue4的回调消息,打印回调参数信息(参数类型必须是string)
			if(typeof v == "string")
				alert(v);
		});
	  }

	  // 绑定事件
	  ue.interface.setFPS = function(fps)
		{
			// set element text
			$("#fpsMeter").text(fps.toFixed(1) + " FPS");
		};
    </script>
  </body>
</html>
打包设置
打包时拷贝Content中的非Asset资产
