关于echart实现label拖拽的实现
echart相关的事件
ECharts 支持常规的鼠标事件类型,包括 ‘click’、 ‘dblclick’、 ‘mousedown’、 ‘mousemove’、 ‘mouseup’、 ‘mouseover’、 ‘mouseout’、 ‘globalout’、 ‘contextmenu’ 事件。我们在拖拽中只需要使用click事件就可以了,因为 ‘mousedown’、 ‘mousemove’、 'mouseup’只能监控到我们当前的一个的图形元素。
myChart.on('click', function(params) {
  // 控制台打印数据的名称
  console.log(params.name);
});
我们会用到click事件,显示当前点击的label,mousedown事件监听当前的需要拖拽的元素对象。
echart事件相对应的写法
chart.on('click', 'series', function() {});
chart.on('click', 'series.line', function() {});
chart.on('click',{ seriesType: "bar" }, function() {});
生成echart(以bar为例书写拖拽,线、散点等等都可以使用)
html
<div id="echart" ref="echart"></div>
css
#echart {
  width: 1000px;
  height: 500px;
  margin: auto;
}
JavaScript
import * as echarts from "echarts";
export default {
  data() {
    return {
      myEchart: null,//echarts实例
      option: {},
      echartsParams: null,
    };
  },
  mounted() {
    this.createEchart();
  },
   methods: {
    createEchart() {
      this.myChart = echarts.init(this.$refs.echart);
      this.option = {
        xAxis: {
          type: "value",
          name: "XXXX",
          nameTextStyle: {
            fontSize: 14,
          },
          // 刻度线
          axisTick: {
            show: false,
          },
          // 轴线
          axisLine: {},
        },
        yAxis: {
          // 网格线
          splitLine: {
            show: false,
          },
          axisLine: {
            show: false,
          },
          axisTick: {
            show: false,
          },
          type: "category",
          name: "YYYY",
          nameTextStyle: {
            fontSize: 14,
          },
          data: [0, 20, 40, 60, 80, 100],
        },
        series: [
          // // 构造树状图
          ...this.getSeriesColumnar({
            footage: [10, 20, 30, 40, 50, 60],
          }),
        ],
      };
      this.option && this.myChart.setOption(this.option);
    },
    getSeriesColumnar(obj) {
      let color = ["#FFB95E", "#CAAFD6"];
      let lineBarSeries = [];
      obj.footage.map((v, i) => {
        let colorObj = {};
        let item = {};
        if (i % 2 != 0) {
          colorObj = {
            itemStyle: {
              color: color[0],
            },
          };
        } else {
          colorObj = {
            itemStyle: {
              color: color[1],
            },
          };
        }
        item = {
          data: [v],
          type: "bar",
          barWidth: 25,
          stack: "total",
          label: {
            show: true,
            formatter: "XXXXYYYY",
            position: "inside",
            fontSize: 0, //取消label的显示,通过点击显示
            width: 150, //label的宽
            offset: [0, 0], //不显示时的位置
          },
          labelLine: {//label 线
            show: true,
            lineStyle: {
              color: "#707070",
              with: 2,
              type: "solid",
              opacity: 0,
            },
          },
        };
        lineBarSeries.push({ ...item, ...colorObj });
      });
      return lineBarSeries;
    },
  },
}
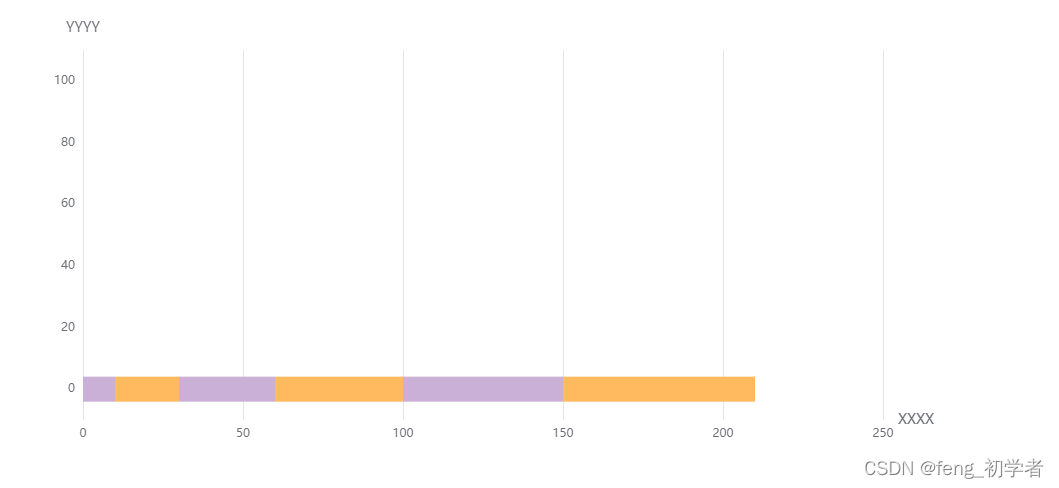
效果:

完整方法实现
JavaScript
import * as echarts from "echarts";
export default {
  data() {
    return {
      myEchart: null,
      option: {},
      echartsParams: null,
      showIndex:0,//显示计数
    };
  },
  mounted() {
    this.createEchart();
  },
  methods: {
    createEchart() {
      this.myChart = echarts.init(this.$refs.echart);
      this.option = {
        xAxis: {
          type: "value",
          name: "XXXX",
          nameTextStyle: {
            fontSize: 14,
          },
          // 刻度线
          axisTick: {
            show: false,
          },
          // 轴线
          axisLine: {},
        },
        yAxis: {
          // 网格线
          splitLine: {
            show: false,
          },
          axisLine: {
            show: false,
          },
          axisTick: {
            show: false,
          },
          type: "category",
          name: "YYYY",
          nameTextStyle: {
            fontSize: 14,
          },
          data: [0, 20, 40, 60, 80, 100],
        },
        series: [
          // // 构造树状图
          ...this.getSeriesColumnar({
            footage: [10, 20, 30, 40, 50, 60],
          }),
        ],
      };
      this.option && this.myChart.setOption(this.option);
      let that = this;
      //点击显示隐藏label
      this.myChart.on("click", { seriesType: "bar" }, function (params) {
        if (
          that.option.series[params.seriesIndex].labelLine.lineStyle.opacity ==
          false
        ) {
          that.option.series[params.seriesIndex].label.fontSize = 12;
          that.showIndex += 1;
          that.option.series[params.seriesIndex].label.offset = [0, 70]; //初始化位置
        } else {
          that.option.series[params.seriesIndex].label.fontSize = 0;
          that.option.series[params.seriesIndex].label.offset = [0, 0];
          that.showIndex -= 1;
        }
        that.option.series[params.seriesIndex].labelLine.lineStyle.opacity =
          !that.option.series[params.seriesIndex].labelLine.lineStyle.opacity;
        that.myChart.setOption(that.option);
      });
      //点击某个bar记录当前bar的params
      this.myChart.on("mousedown", { seriesType: "bar" }, function (params) {
        that.echartsParams = params;
        //添加up事件
        document
          .getElementById("echart")
          .addEventListener("mouseup", that.mouseUpEchart);
      });
    },
    mouseUpEchart(e) {
      let that = this;
      //计算当前鼠标拖动后的位置
      const initX =
        that.echartsParams.event.offsetX -
        that.option.series[that.echartsParams.seriesIndex].label.offset[0];
      const initY =
        that.echartsParams.event.offsetY -
        that.option.series[that.echartsParams.seriesIndex].label.offset[1];
      that.option.series[that.echartsParams.seriesIndex].label.offset = [
        e.offsetX - initX,
        e.offsetY - initY,
      ];
      //重新set图例
      that.myChart.setOption(that.option);
      //注销事件
      document
        .getElementById("echart")
        .removeEventListener("mouseup", that.mouseUpEchart);
    },
    getSeriesColumnar(obj) {
      let color = ["#FFB95E", "#CAAFD6"];
      let lineBarSeries = [];
      obj.footage.map((v, i) => {
        let colorObj = {};
        let item = {};
        if (i % 2 != 0) {
          colorObj = {
            itemStyle: {
              color: color[0],
            },
          };
        } else {
          colorObj = {
            itemStyle: {
              color: color[1],
            },
          };
        }
        item = {
          data: [v],
          type: "bar",
          barWidth: 25,
          stack: "total",
          label: {
            show: true,
            formatter: "XXXXYYYY",
            position: "inside",
            fontSize: 0,
            width: 150,
            offset: [0, 0],
          },
          labelLine: {
            show: true,
            lineStyle: {
              color: "#707070",
              with: 2,
              type: "solid",
              opacity: 0,
            },
          },
        };
        lineBarSeries.push({ ...item, ...colorObj });
      });
      return lineBarSeries;
    },
  },
};
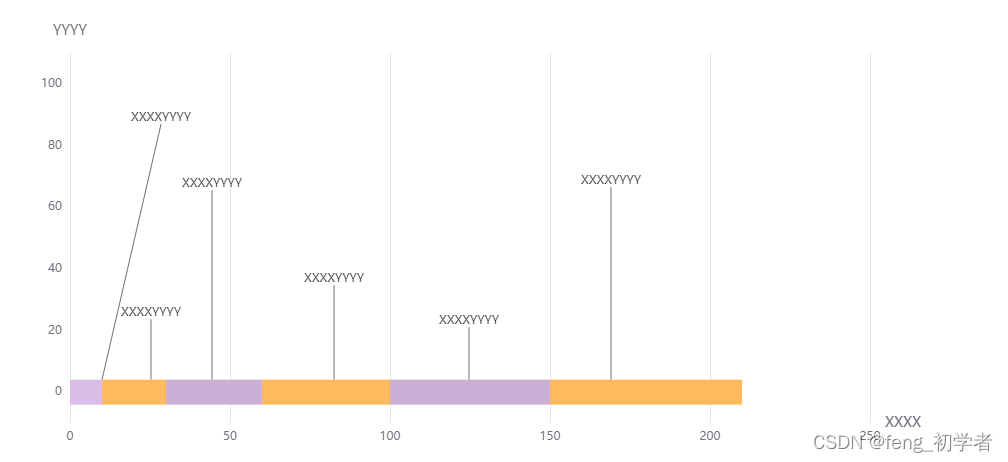
演示效果

