目录
????????? 1.1 Harris角点检测算法的基本思想
1. Harris角点检测算法
1.1 Harris角点检测算法的基本思想
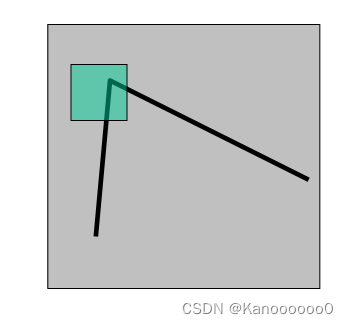
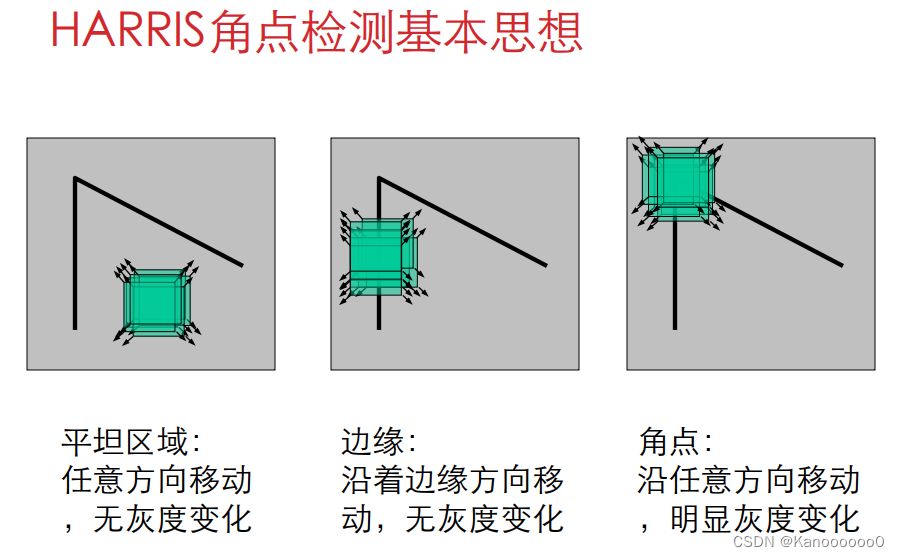
????????从图像局部的小窗口观察图像特征。
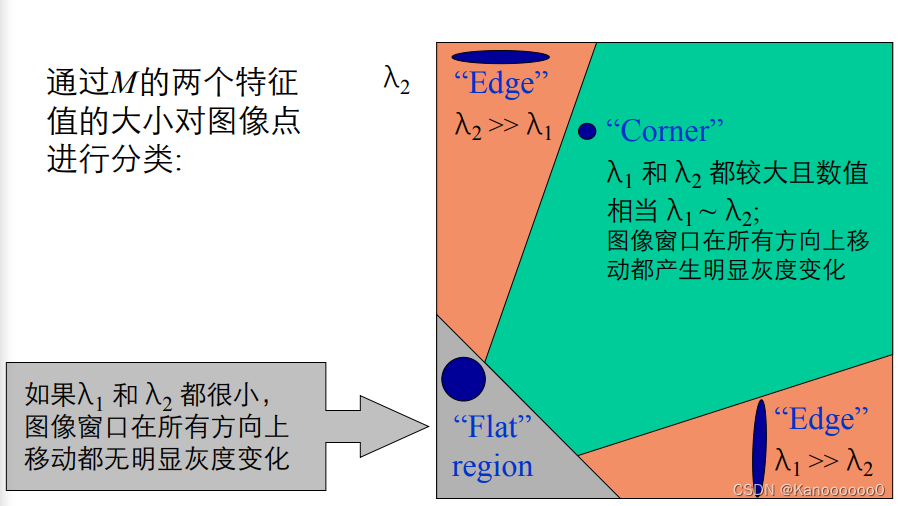
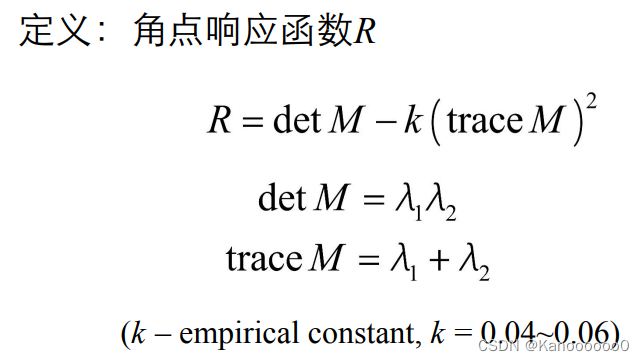
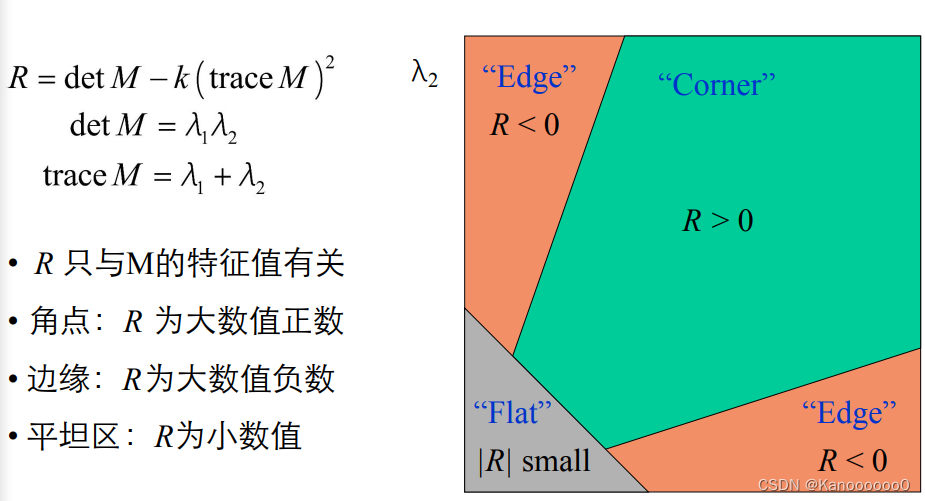
????????角点定义:窗口向任意方向的移动都导致图像灰度的明显变化。
? 1.2 Harris角点检测算法的数学表达
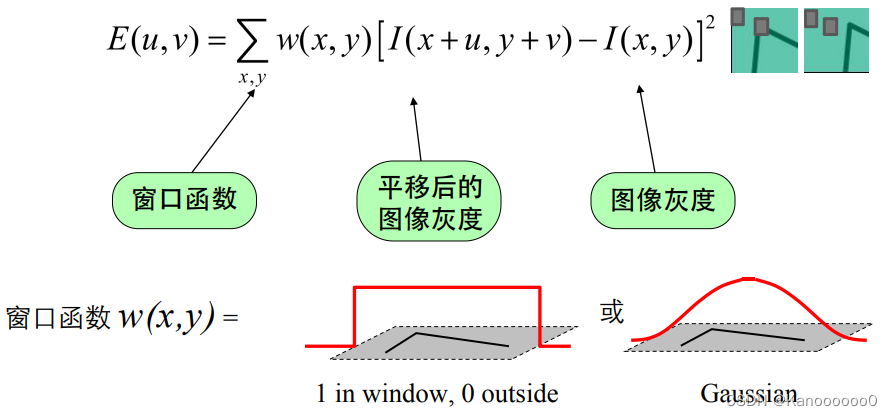
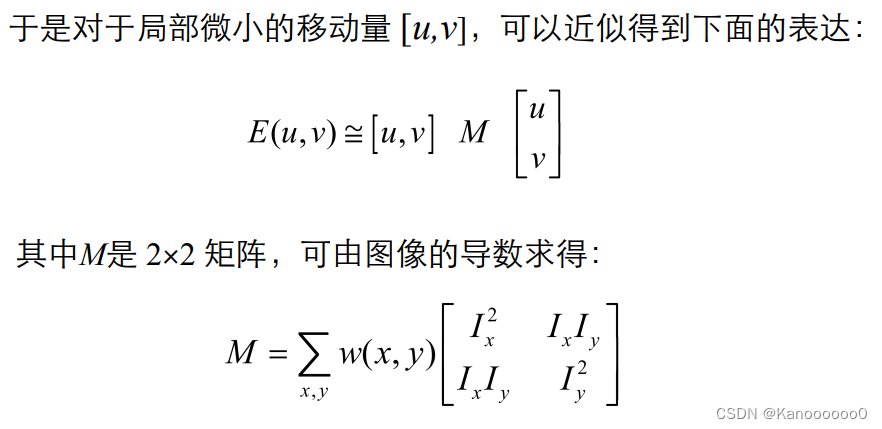
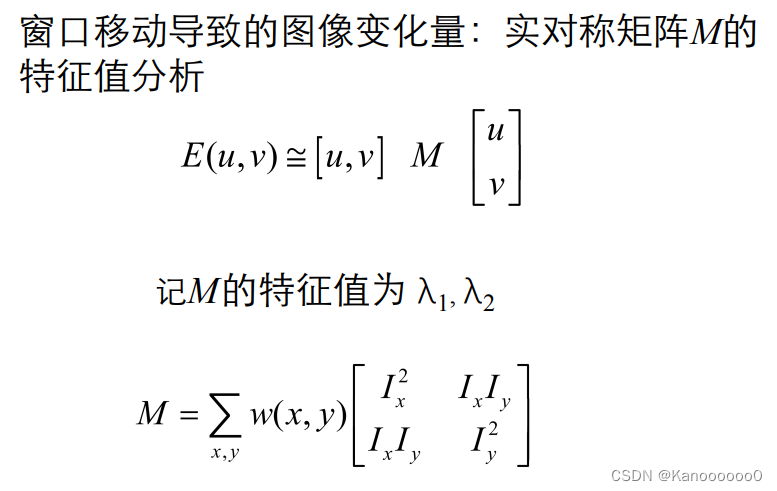
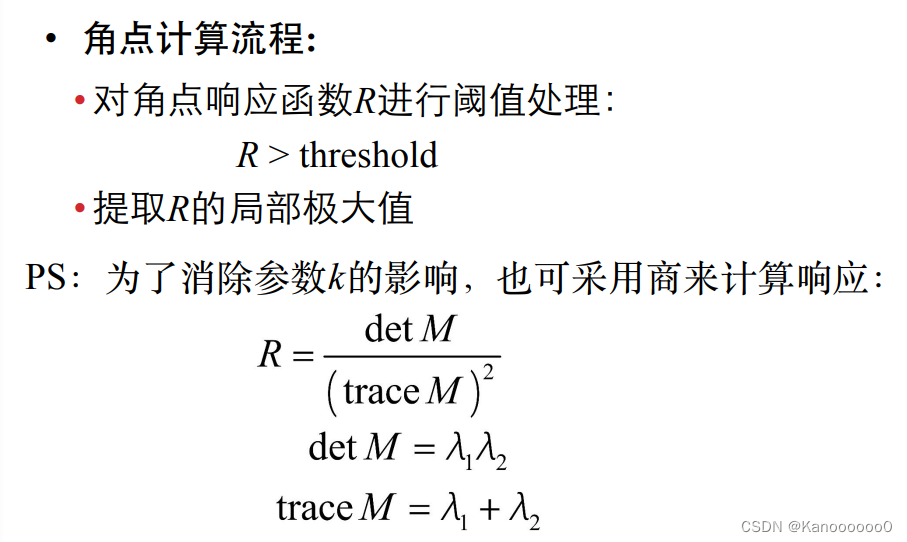
????????将图像窗口平移[u,v]产生灰度变化E(u,v)。
????????
?
 ?
?
 ?
?
?
?
?1.3 Harris角点检测算法的代码实现
from pylab import *
from numpy import *
from scipy.ndimage import filters
from PIL import Image


def compute_harris_response(im,sigma=3):
    """ Compute the Harris corner detector response function
        for each pixel in a graylevel image. """

    # derivatives
    imx = zeros(im.shape)
    filters.gaussian_filter(im, (sigma,sigma), (0,1), imx)
    imy = zeros(im.shape)
    filters.gaussian_filter(im, (sigma,sigma), (1,0), imy)

    # compute components of the Harris matrix
    Wxx = filters.gaussian_filter(imx*imx,sigma)
    Wxy = filters.gaussian_filter(imx*imy,sigma)
    Wyy = filters.gaussian_filter(imy*imy,sigma)

    # determinant and trace
    Wdet = Wxx*Wyy - Wxy**2
    Wtr = Wxx + Wyy

    return Wdet / Wtr


def get_harris_points(harrisim,min_dist=10,threshold=0.1):
    """ Return corners from a Harris response image
        min_dist is the minimum number of pixels separating
        corners and image boundary. """

    # find top corner candidates above a threshold
    corner_threshold = harrisim.max() * threshold
    harrisim_t = (harrisim > corner_threshold) * 1

    # get coordinates of candidates
    coords = array(harrisim_t.nonzero()).T

    # ...and their values
    candidate_values = [harrisim[c[0],c[1]] for c in coords]

    # sort candidates (reverse to get descending order)
    index = argsort(candidate_values)[::-1]

    # store allowed point locations in array
    allowed_locations = zeros(harrisim.shape)
    allowed_locations[min_dist:-min_dist,min_dist:-min_dist] = 1

    # select the best points taking min_distance into account
    filtered_coords = []
    for i in index:
        if allowed_locations[coords[i,0],coords[i,1]] == 1:
            filtered_coords.append(coords[i])
            allowed_locations[(coords[i,0]-min_dist):(coords[i,0]+min_dist),
                        (coords[i,1]-min_dist):(coords[i,1]+min_dist)] = 0

    return filtered_coords


def plot_harris_points(image,filtered_coords):
    """ Plots corners found in image. """

    figure()
    gray()
    imshow(image)
    plot([p[1] for p in filtered_coords],
                [p[0] for p in filtered_coords],'*')
    axis('off')
    show()


def get_descriptors(image,filtered_coords,wid=5):
    """ For each point return pixel values around the point
        using a neighbourhood of width 2*wid+1. (Assume points are
        extracted with min_distance > wid). """

    desc = []
    for coords in filtered_coords:
        patch = image[coords[0]-wid:coords[0]+wid+1,
                            coords[1]-wid:coords[1]+wid+1].flatten()
        desc.append(patch)

    return desc


def match(desc1,desc2,threshold=0.5):
    """ For each corner point descriptor in the first image,
        select its match to second image using
        normalized cross correlation. """

    n = len(desc1[0])

    # pair-wise distances
    d = -ones((len(desc1),len(desc2)))
    for i in range(len(desc1)):
        for j in range(len(desc2)):
            d1 = (desc1[i] - mean(desc1[i])) / std(desc1[i])
            d2 = (desc2[j] - mean(desc2[j])) / std(desc2[j])
            ncc_value = sum(d1 * d2) / (n-1)
            if ncc_value > threshold:
                d[i,j] = ncc_value

    ndx = argsort(-d)
    matchscores = ndx[:,0]

    return matchscores


def match_twosided(desc1,desc2,threshold=0.5):
    """ Two-sided symmetric version of match(). """

    matches_12 = match(desc1,desc2,threshold)
    matches_21 = match(desc2,desc1,threshold)

    ndx_12 = where(matches_12 >= 0)[0]

    # remove matches that are not symmetric
    for n in ndx_12:
        if matches_21[matches_12[n]] != n:
            matches_12[n] = -1

    return matches_12


def appendimages(im1,im2):
    """ Return a new image that appends the two images side-by-side. """

    # select the image with the fewest rows and fill in enough empty rows
    rows1 = im1.shape[0]
    rows2 = im2.shape[0]

    if rows1 < rows2:
        im1 = concatenate((im1,zeros((rows2-rows1,im1.shape[1]))),axis=0)
    elif rows1 > rows2:
        im2 = concatenate((im2,zeros((rows1-rows2,im2.shape[1]))),axis=0)
    # if none of these cases they are equal, no filling needed.

    return concatenate((im1,im2), axis=1)


def plot_matches(im1,im2,locs1,locs2,matchscores,show_below=True):
    """ Show a figure with lines joining the accepted matches
        input: im1,im2 (images as arrays), locs1,locs2 (feature locations),
        matchscores (as output from 'match()'),
        show_below (if images should be shown below matches). """

    im3 = appendimages(im1,im2)
    if show_below:
        im3 = vstack((im3,im3))

    imshow(im3)

    cols1 = im1.shape[1]
    for i,m in enumerate(matchscores):
        if m>0:
            plot([locs1[i][1],locs2[m][1]+cols1],[locs1[i][0],locs2[m][0]],'c')
    axis('off')


if __name__ == '__main__':
    im = array(Image.open('C:\\Users\\Kano\\Desktop\\1.jpg').convert('L'))
    harrisim = compute_harris_response(im)
    filtered_coords = get_harris_points(harrisim,6)
    plot_harris_points(im, filtered_coords)
?
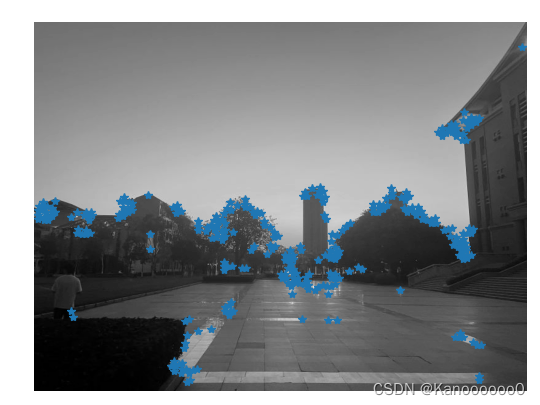
2. SIFT算法
2.1 SIFT算法的基本原理
? ? ? ? SIFT算法是在图像尺度空间的基础上,提出了对图像缩放、旋转保持不变形的图像局部特征描述算子—SIFT(尺度不变特征变换)。
? ? ? ? SIFT算法可以解决的问题
? ? ? ? ? ? ? ? 1.目标的旋转、缩放、平移(RST)
? ? ? ? ? ? ? ? 2.图像仿射、投影变换(视点viewpoint)
? ? ? ? ? ? ? ? 3.弱光照影响(illumination)
? ? ? ? ? ? ? ? 4.部分目标遮挡(occlusion)
? ? ? ? ? ? ? ? 5.杂物场景(clutter)
? ? ? ? ? ? ? ? 6.噪声(noise)
? ? ? ? SIFT算法实现步骤简述:
????????实质可以归为在不同尺度空间上查找特征点(关键点)的问题。SIFT算法实现特征匹配主要有三个流程,1、提取关键点;2、对关键点附加 详细的信息(局部特征),即描述符;3、通过特征点(附带上特征向量的关 键点)的两两比较找出相互匹配的若干对特征点,建立景物间的对应关系。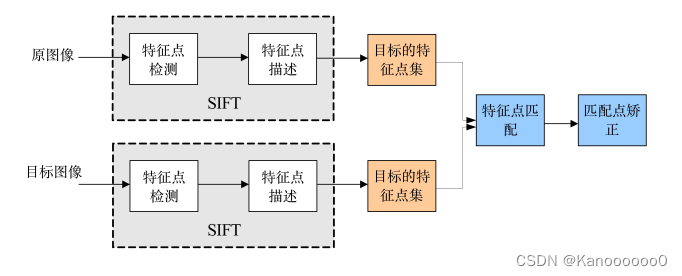
?2.2 关键点检测的相关概念
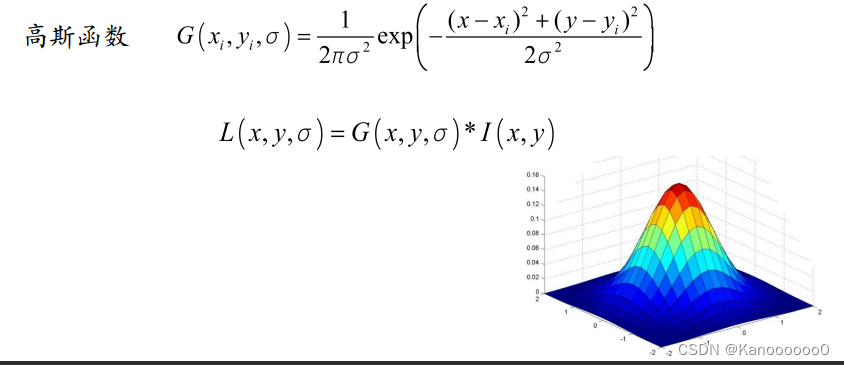
????????根据文献《Scale-space theory: A basic tool for analysing structures at different scales》可知,高斯核可以产生 多尺度空间的核,一个图像的 尺度空间,L(x, y, σ) ,定义为原始图像 I(x, y)与一个可变尺度的2维高斯 函数G(x, y, σ) 卷积运算。
????????
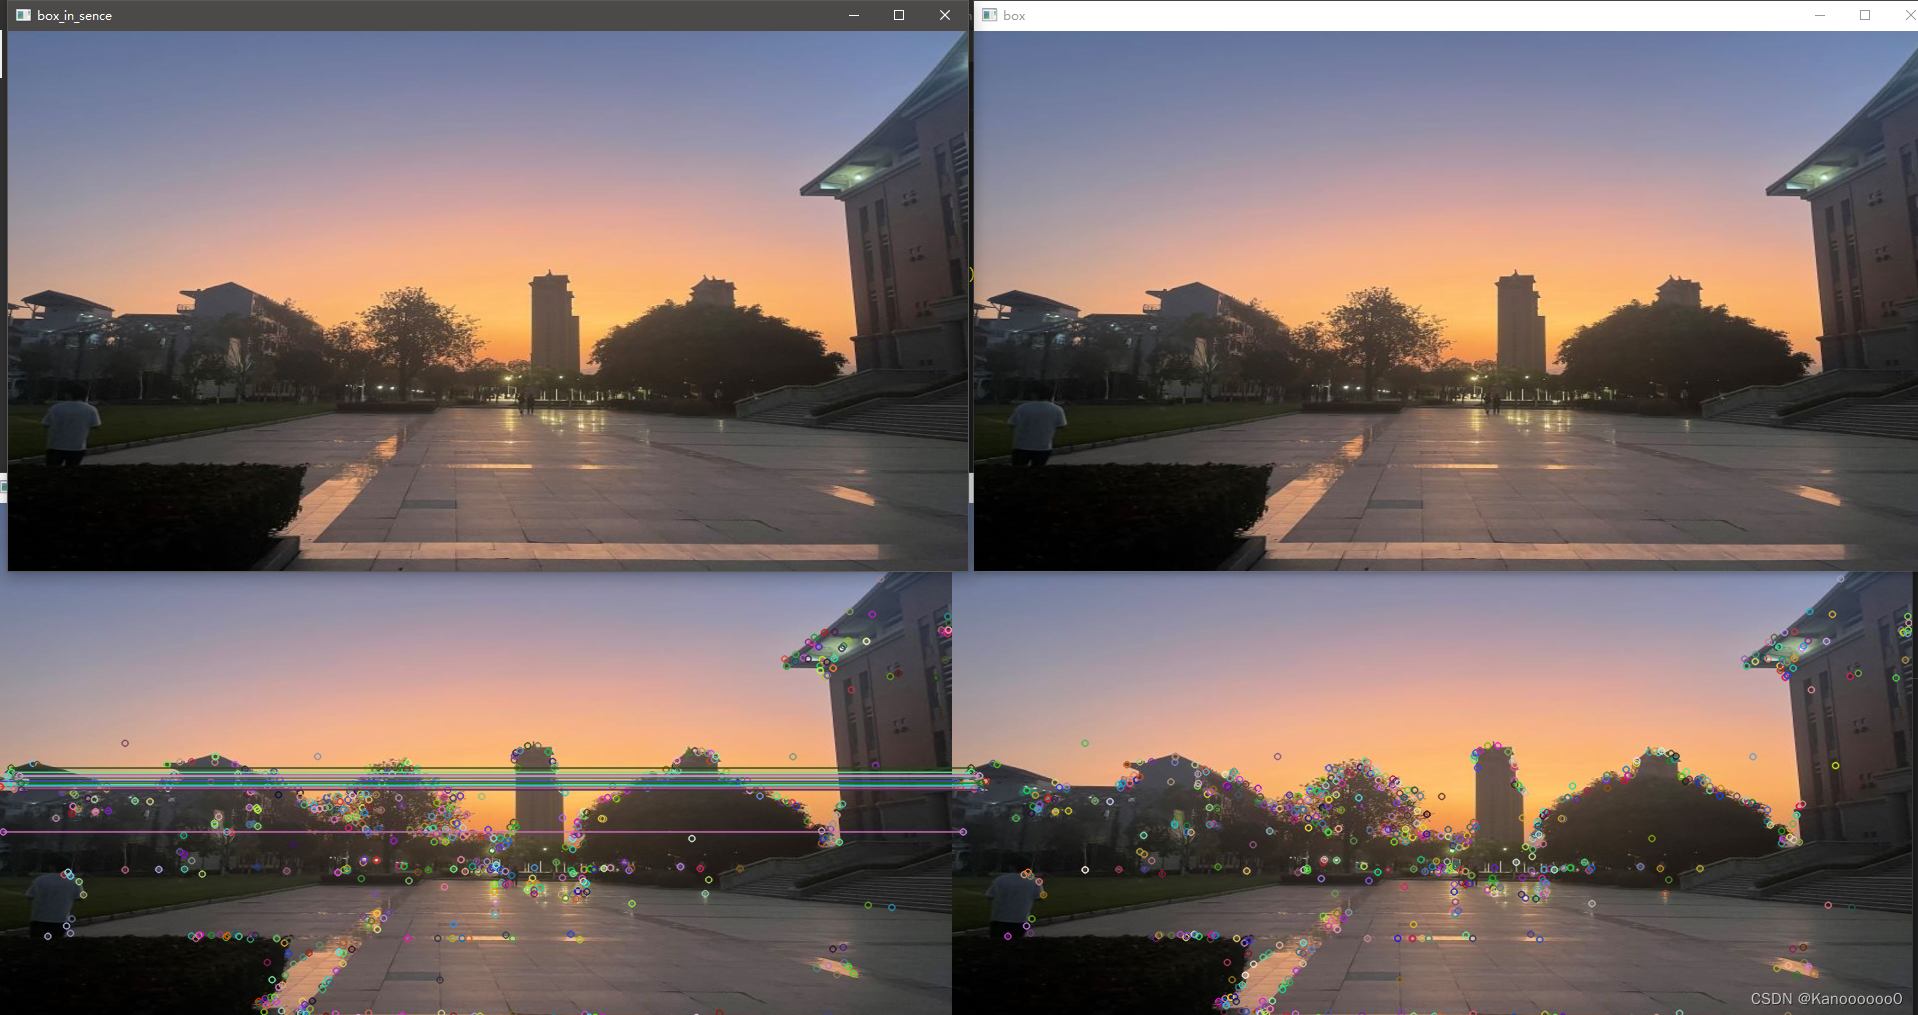
2.3 SIFT算法特征的代码实现
?
import cv2 as cv
from cv2 import waitKey
import numpy as np
import matplotlib.pyplot as plt
if __name__ == '__main__':
    box = cv.imread("C:\\Users\\19835\\Desktop\\opencv\\task2\\task_1.jpg")
    # 压缩图片以便显示
    box=cv.resize(box,(960,540))
    box_in_sence = cv.imread("C:\\Users\\19835\\Desktop\\opencv\\task2\\task_2.jpg")
    box_in_sence=cv.resize(box_in_sence,(960,540))
    cv.imshow("box", box)
    cv.imshow("box_in_sence", box_in_sence)

    # 创建SIFT特征检测器
    sift = cv.SIFT_create()

    # 特征点提取与描述子生成
    kp1, des1 = sift.detectAndCompute(box,None)
    kp2, des2 = sift.detectAndCompute(box_in_sence,None)

    # 暴力匹配
    bf = cv.DescriptorMatcher_create(cv.DescriptorMatcher_BRUTEFORCE)
    matches = bf.match(des1,des2)

    # 绘制最佳匹配
    matches = sorted(matches, key = lambda x:x.distance)
    result = cv.drawMatches(box, kp1, box_in_sence, kp2, matches[:15], None)
    cv.imshow("-match", result)
    cv.waitKey(0)
    cv.destroyAllWindows()
?
?2.4 SIFT匹配地理标记图像
from pylab import *
from PIL import Image
from PCV.localdescriptors import sift
from PCV.tools import imtools
import pydot

#download_path = "panoimages"  # set this to the path where you downloaded the panoramio images
#path = "/FULLPATH/panoimages/"  # path to save thumbnails (pydot needs the full system path)

download_path = "C:\\Users\\Kano\\Desktop\\Study\\computer vision\\Test2"  # set this to the path where you downloaded the panoramio images
path = "C:\\Users\\Kano\\Desktop\\Study\\computer vision\\Test2"  # path to save thumbnails (pydot needs the full system path)

# list of downloaded filenames
imlist = imtools.get_imlist(download_path)
nbr_images = len(imlist)

# extract features
featlist = [imname[:-3] + 'sift' for imname in imlist]
for i, imname in enumerate(imlist):
    sift.process_image(imname, featlist[i])

matchscores = zeros((nbr_images, nbr_images))

for i in range(nbr_images):
    for j in range(i, nbr_images):  # only compute upper triangle
        print ('comparing ', imlist[i], imlist[j])
        l1, d1 = sift.read_features_from_file(featlist[i])
        l2, d2 = sift.read_features_from_file(featlist[j])
        matches = sift.match_twosided(d1, d2)
        nbr_matches = sum(matches > 0)
        print ('number of matches = ', nbr_matches)
        matchscores[i, j] = nbr_matches
print ("The match scores is: \n", matchscores)

# copy values
for i in range(nbr_images):
    for j in range(i + 1, nbr_images):  # no need to copy diagonal
        matchscores[j, i] = matchscores[i, j]

#可视化

threshold = 2  # min number of matches needed to create link

g = pydot.Dot(graph_type='graph')  # don't want the default directed graph

for i in range(nbr_images):
    for j in range(i + 1, nbr_images):
        if matchscores[i, j] > threshold:
            # first image in pair
            im = Image.open(imlist[i])
            im.thumbnail((100, 100))
            filename = path + str(i) + '.png'
            im.save(filename)  # need temporary files of the right size
            g.add_node(pydot.Node(str(i), fontcolor='transparent', shape='rectangle', image=filename))

            # second image in pair
            im = Image.open(imlist[j])
            im.thumbnail((100, 100))
            filename = path + str(j) + '.png'
            im.save(filename)  # need temporary files of the right size
            g.add_node(pydot.Node(str(j), fontcolor='transparent', shape='rectangle', image=filename))

            g.add_edge(pydot.Edge(str(i), str(j)))
g.write_png('test.png')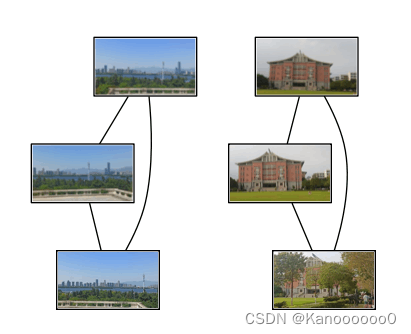
?
