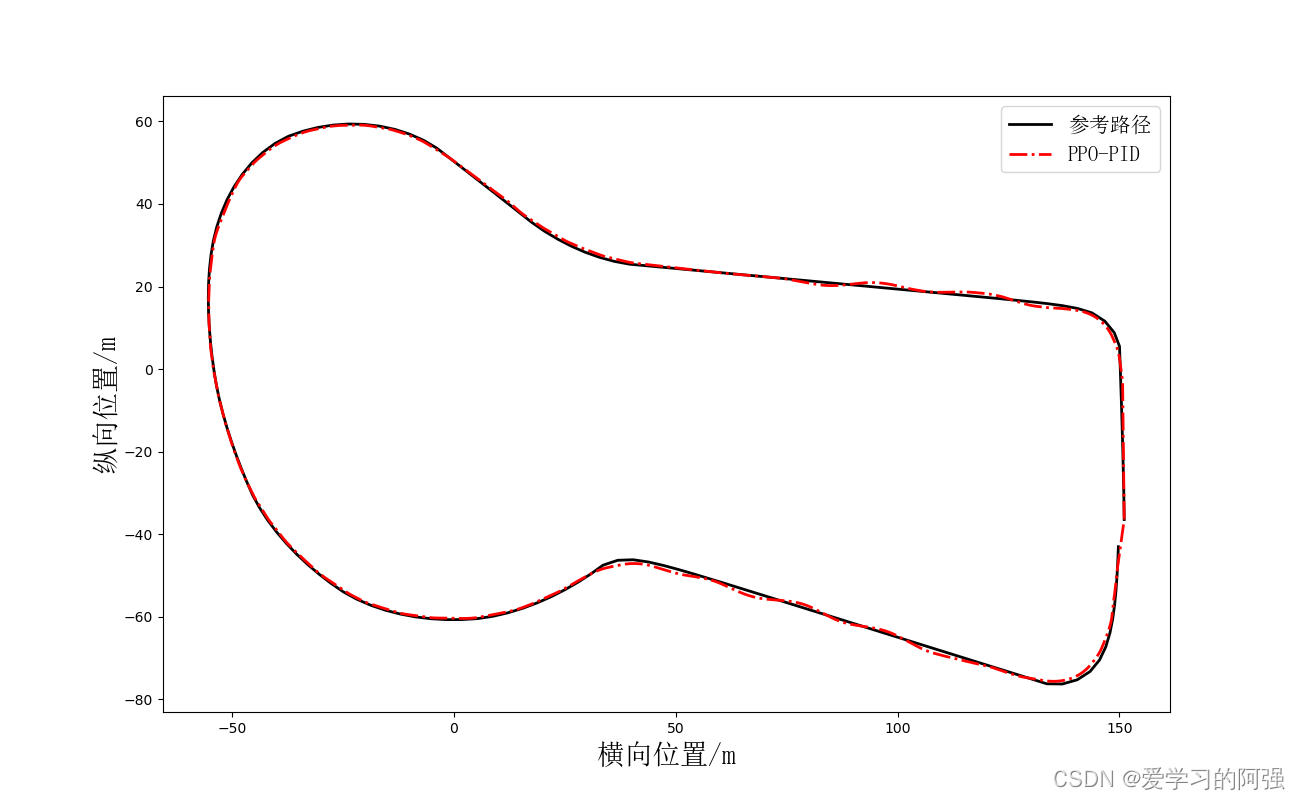
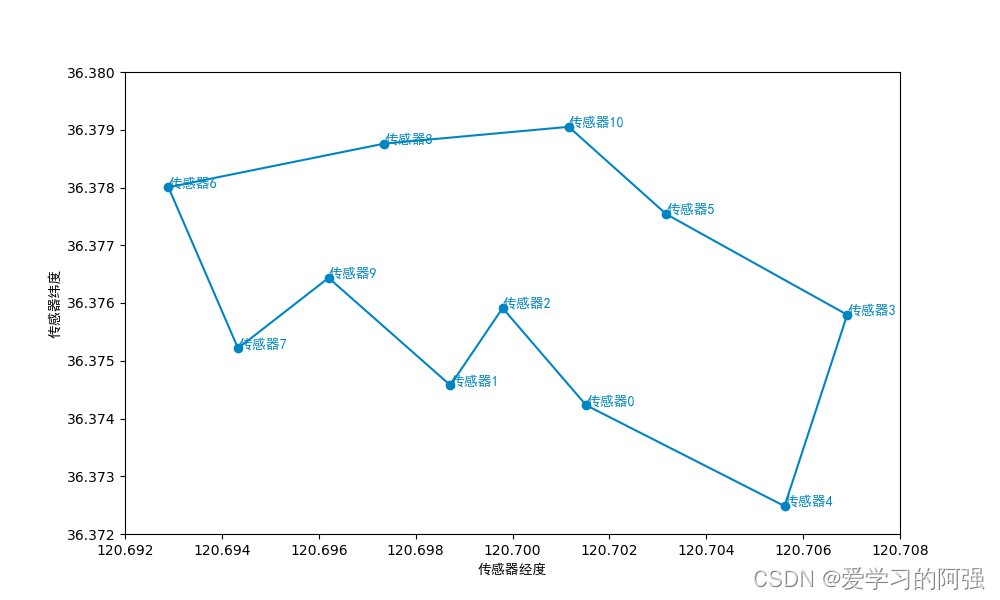
绘图效果如下所示:

matplot介绍:
1.plt.plot() 画图函数
plt.plot(x,y,label, ls, linewidth, color,marker)
| 参数名 | 含义 |
|---|---|
| x | 横坐标集合 |
| y | 纵坐标集合 |
| label | 添加曲线标签,后使用plt.legend( )创建图例。 |
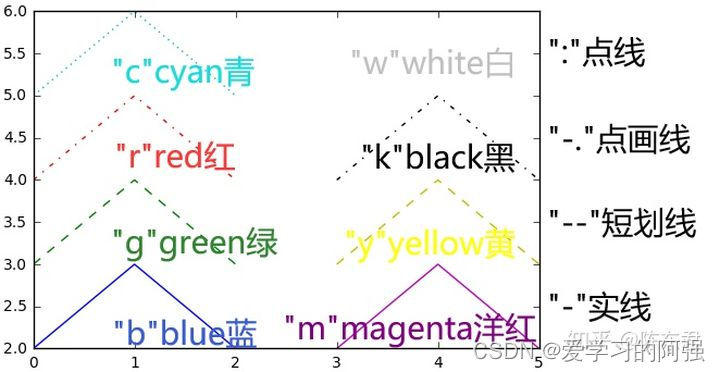
| ls | linestyle,可以定义为’-', ‘–’, ‘-.’, ‘:’, ‘None’, ’ ', ‘’, ‘solid’, ‘dashed’, ‘dashdot’, ‘dotted’。效果如下图所示。 |
| linewidth | 曲线宽度 |
| color | ‘b’ 蓝色,‘m’ 洋红色,‘g’ 绿色,‘y’ 黄色,‘r’ 红色,‘k’ 黑色,‘w’ 白色,‘c’ 青绿色,‘#008000’ RGB 颜色符串。多条曲线不指定颜色时,会自动选择不同颜色。 |
| marker | o圆圈 .点 *星号 |

plt.legend()的作用:在plt.plot() 定义后plt.legend() 会显示该 label 的内容,否则会报error: No handles with labels found to put in legend.
plt.xlabel(‘横坐标显示内容’,fontproperties=font_set)
plt.ylabel(‘纵坐标显示内容/m’,fontproperties=font_set)
如果是中文必须设置字体,不然显示不出来
代码
import csv
import matplotlib.pyplot as plt
from matplotlib.font_manager import FontProperties

#设置宋体字体,不然中文字体无法正常显示
font_set = FontProperties(fname=r"c:\windows\fonts\simsun.ttc", size=20)

# 读取csv数据
def readCsv(path):
    pose = []
    with open(path) as f:
        f_csv = csv.reader(f)
        # headers = next(f_csv)
        for row in f_csv:
            p = [float(row[0]), float(row[1])]
            pose.append(p)
    return pose

def drawPic(data):
    plt.figure(figsize=(13, 8))
    color = ['black','red']
    label = ["参考路径", 'PPO-PID']
    linestyle = ['--', '-.']
    linewidth = [2, 2]
    for j in range(len(data)):
        x = []
        y = []
        for p in data[j]:
            x.append(p[0])
            y.append(p[1])
        plt.plot(x,y,label=label[j], ls=linestyle[j], linewidth=linewidth[j], color=color[j])

    plt.legend(prop={'family':'SimSun','size':15})
    plt.xlabel('横向位置/m',fontproperties=font_set)
    plt.ylabel('纵向位置/m',fontproperties=font_set)
    # plt.axis('off')
    plt.show()

path_name1 = 'H:/python-workspace/PPO-PyTorch-master/参考路径.csv'
path_name2 = 'C:/Users/yangqiang/Documents/WeChat Files/wxid_7089350895312/FileStorage/File/2022-04/车体坐标 - 副本.csv'

pose1 = readCsv(path_name1)
pose2 = readCsv(path_name2)

# 多条轨迹组成数据集 [pose1, pose2, pose3...]
data = [pose1,pose2]
drawPic(data)
另一种轨迹图

import matplotlib.pyplot as plt

# 各个点的经纬度及编号
l = [[120.7015202, 36.37423, 0],
     [120.7056165, 36.37248342, 4],
     [120.70691, 36.37579616, 3],
     [120.7031731, 36.37753964, 5],
     [120.7011609, 36.37905063, 10],
     [120.6973521, 36.37876006, 8],
     [120.6928965, 36.37800457, 6],
     [120.6943337, 36.37521499, 7],
     [120.6962022, 36.37643544, 9],
     [120.6987175, 36.37457569, 1],
     [120.6997954, 36.37591239, 2],
     [120.7015202, 36.37423, 0]]


def drawPic(dots):
    plt.figure(figsize=(10, 6))
    plt.xlim(120.692, 120.708, 0.002)  # x轴的刻度范围
    plt.ylim(36.372, 36.380, 0.001)  # y轴的刻度范围
    plt.xlabel('传感器经度', fontproperties="simhei")  # x轴的标题
    plt.ylabel('传感器纬度', fontproperties="simhei")  # y轴的标题
    # 绘制各个点及点所代表地点名称
    for i in range(len(dots) - 1):
        plt.text(l[i][0], l[i][1], '传感器' + str(l[i][2]), color='#0085c3', fontproperties="simhei")
        plt.plot(l[i][0], l[i][1], 'o', color='#0085c3')
    # 连接各个点
    for i in range(len(dots) - 1):
        start = (l[i][0], l[i + 1][0])
        end = (l[i][1], l[i + 1][1])
        plt.plot(start, end, color='#0085c3')
    plt.show()


drawPic(l)
