本文的算法来源为以上论文。
第一步:环境的搭建
需要的材料有 :
- linux服务器一台(不用性能太高,如果仅仅用来测试该代码的话)。
- 建议有一个好的shell工具(推荐finalshell,免费)。
Linux环境的配置:
进入该论文的代码开源网址。将代码下载到本地,解压然后上传到自己的linux服务器上。?

?当然,在Linux服务器上需要下载python。然后下载一个虚拟环境(方便不同的项目同时进行)。
//在安装完python后,安装虚拟环境
pip install virtualenv

//进入自己下载的文件目录后,创建虚拟环境(tda_env是自己起虚拟文件夹名字)
virtualenv tda_env
//启动虚拟环境
source tda_env/bin/activate


//如需退出虚拟环境,则
deactivate
?进入虚拟环境后就开始安装对应的python包
直接:(在你下载的工程目录下)
pip install -r requirments.txt
?如果这几个包安装报错,需要自己想办法下载到本地,再自己上传到Linux里,具体例子如下:
//在该目录下下载git包
git clone https://github.com/MathieuCarriere/statmapper.git

//进入该包目录
cd statmapper

//pip本地安装
pip install .
?到这里,如果没有啥问题的话,环境就配置好了,应该是可以开始跑代码了,如果有问题可以私信我(估计也没啥人哈哈)。
代码模块解说

?由于数据还没有公开的原因,使得该论文用到的数据无法共享给我们,所以该论文发布者写了个prepare_inputs.py来模拟数据。(中文注释是我加上的)
prepare_inputs.py整体代码
# Title: Prepare pipeline inputs for different parameter combinations
# Author: Ewan Carr (@ewancarr)
# Updated: 2021-02-10
import os
import shutil
import pickle
import csv
import pandas as pd
import numpy as np
from sklearn.manifold import MDS
from sklearn.cluster import DBSCAN, AgglomerativeClustering
from sklearn.datasets import make_multilabel_classification
import gower
import urllib.request
#用来调试
debug=1
# Check if input dataset is available
data_avail = os.path.exists('input.csv')
# Load dataset if available; otherwise simulate, 即如果没有则模仿(随机生成)一个输入
# n_samples的初始值为430
if data_avail:
data = pd.read_csv('input.csv').dropna()
else:
sim = make_multilabel_classification(n_samples = 430,
n_features = 137,
n_classes = 8)
data = pd.DataFrame(sim[0])
data.columns = ['X' + str(i + 1) for i in data.columns]
data['fila'] = np.random.uniform(-5, 5, len(data.index))
data['filb'] = np.random.uniform(-5, 5, len(data.index))
data['ycont'] = np.random.uniform(30, 80, len(data.index))
data['ybin'] = data['ycont'] > 60
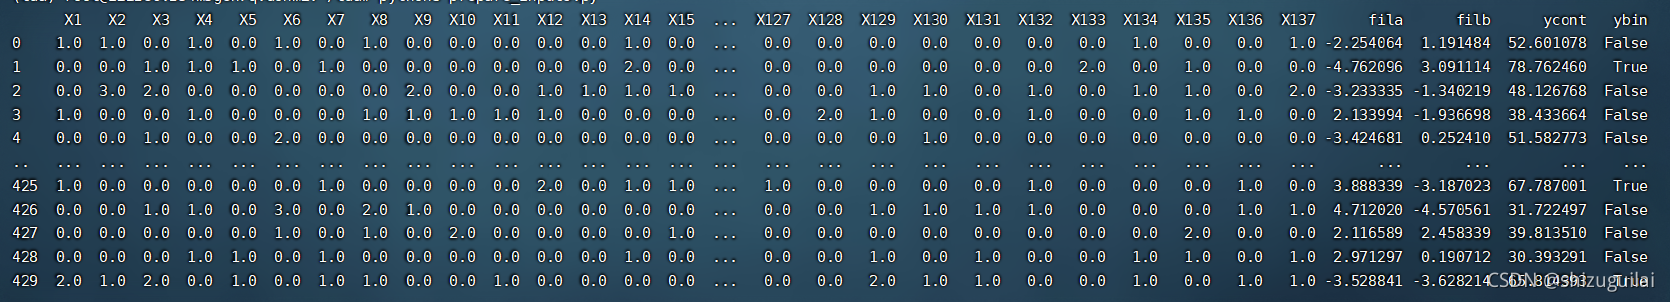
if debug==1:
print(data)
# Identify categorical items
"""
For computing the Gower matrix (this file) and descriptive statistics
(later) we need to specify which variables in the input dataset should
be treated as categorical. This can be specified with a CSV file
containing the columns 'index' and 'categorical':
即使用categotical_items.csv告诉系统哪个是类别变量
index: A column of variable names matching those in 'input.csv'
categorical: A column of 0 or 1 indicating wether each variable should
be treated as categorical.
"""
if data_avail:
categ = pd.read_csv('categorical_items.csv')[['index', 'categorical']]
else:
categ = pd.DataFrame({'index': list(data),
'categorical': np.concatenate([np.repeat(1, 137),
np.array([0, 0, 0, 1])])})
categ.to_csv('categorical_items.csv')
#如果csv中的值为1,则该属性为类别变量
is_categ = categ['categorical'].values == 1
if debug==1:
print(is_categ)
# Compute Gower distance matrix, 即任何两点之间的距离
gmat = gower.gower_matrix(data, cat_features=is_categ)
if debug==1:
print(np.shape(gmat))
# ┏━━━━━━━━━━━━━━━━━━━━━━━━━━━━━━━━━━━━━━━━━━━━━━━━━━━━━━━━━━━━━━━━━━━━━━━━━━━┓
# ┃ ┃
# ┃ Define parameter settings ┃
# ┃ ┃
# ┗━━━━━━━━━━━━━━━━━━━━━━━━━━━━━━━━━━━━━━━━━━━━━━━━━━━━━━━━━━━━━━━━━━━━━━━━━━━┛
# Define filters ==============================================================
fil = {}
# MDS, with Gower distance matrix, first two components,对距离矩阵MDS进行降维到2维
# n_components,它确定了降维的维数
fil['mds'] = MDS(n_components=2,
dissimilarity='precomputed').fit_transform(gmat)
# MADRS, BDI, PRS, 就下面这三个是连续型变量
fil['fila'] = data['fila'].values
fil['filb'] = data['filb'].values
fil['ycont'] = data['ycont'].values
# Create combinations of the above
for j in ['fila', 'filb', 'ycont']:
fil['mds' + '_' + j] = np.column_stack([fil['mds'], fil[j]])
if debug==1:
print("fil:")
print(fil)
print("fill.item:")
print(fil.items())
#fil中的列为,mds, fila, filb, ycont, mds_fila, mds_filb, mds_ycont
# Define clustering algorithm =================================================
# 使用DBSCAN密度聚类算法
cluster = [DBSCAN(eps=i, metric='precomputed')
for i in[0.5, 1, 5, 10, 50, 100]]
cluster.append(AgglomerativeClustering(affinity='precomputed',
linkage='average'))
cluster.append('auto')
# Define resolutions ==========================================================
resolutions = [(res, c)
for res in [1, 3, 5, 10, 30, 50]
for c in cluster]
resolutions.append((np.nan, None))
# if debug==1:
# print("resolutions:")
# print(resolutions)
# Create dictionary containing all combinations of input parameters ===========
# 得到一个参数的组合
params = [{'fil': f,
'res': r,
'gain': gain}
for f in fil.items()
for r in resolutions
for gain in [0.1, 0.2, 0.3, 0.4]]
# ┏━━━━━━━━━━━━━━━━━━━━━━━━━━━━━━━━━━━━━━━━━━━━━━━━━━━━━━━━━━━━━━━━━━━━━━━━━━━┓
# ┃ ┃
# ┃ Generate input files for all combinations ┃
# ┃ ┃
# ┗━━━━━━━━━━━━━━━━━━━━━━━━━━━━━━━━━━━━━━━━━━━━━━━━━━━━━━━━━━━━━━━━━━━━━━━━━━━┛
# Set folder to store input files
inp = 'inputs'
out = 'outputs'
# Create folder for inputs; delete if exists already
if os.path.isdir(inp):
shutil.rmtree(inp)
os.mkdir(inp)
if not os.path.isdir(out):
os.mkdir(out)
for i, p in enumerate(params, 1):
gid = f'{i:04}'
# Save params as pickle
with open(os.path.join(inp, gid + '.pickle'), 'wb') as f:
pickle.dump(p, f) #将每一组参数储存为2进制对象
# Add to index CSV,同时保存在csv文件里
with open(os.path.join(inp, 'index.csv'), 'a') as f:
writer = csv.writer(f)
writer.writerow([gid,
str(p['fil'][0]),
str(p['gain']),
str(p['res'][0]),
str(p['res'][1])])
# Add to job list for GNU parallel
with open('jobs', 'a+') as f:
f.write('python test_single_graph.py ' + gid + ' inputs outputs\n')
# ┏━━━━━━━━━━━━━━━━━━━━━━━━━━━━━━━━━━━━━━━━━━━━━━━━━━━━━━━━━━━━━━━━━━━━━━━━━━━┓
# ┃ ┃
# ┃ Export other required datasets ┃
# ┃ ┃
# ┗━━━━━━━━━━━━━━━━━━━━━━━━━━━━━━━━━━━━━━━━━━━━━━━━━━━━━━━━━━━━━━━━━━━━━━━━━━━┛
# Binary 12-week outcome ------------------------------------------------------
data['ybin'].to_csv(os.path.join(inp, 'ybin.csv'), index=False, header=False)
data['ycont'].to_csv(os.path.join(inp, 'ycont.csv'), index=False, header=False)
# Baseline clinical features (excluding any outcomes) -------------------------
to_drop = ['fila', 'filb', 'ycont', 'ybin']
data.drop(columns=to_drop, axis=1) \
.to_csv(os.path.join(inp, 'X.csv'), index=False, header=True)
# Gower distance matrix
pd.DataFrame(gmat).to_csv(os.path.join(inp, 'gower.csv'),
index=False,
header=False)
?上面这一堆代码只有一个目的,就是生成训练模型用的测试数据。
运行完后会生成1372个pickle文件,以及5个csv文件。
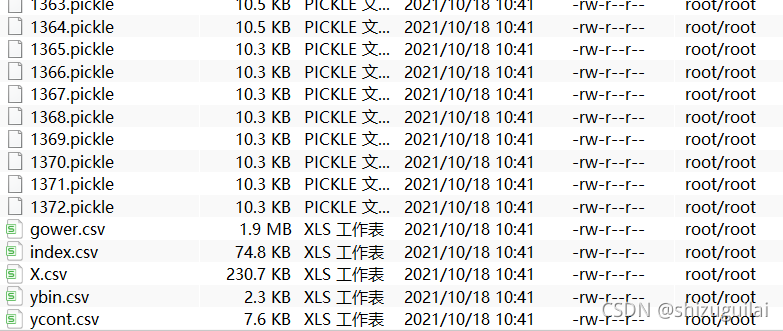
?其中pickle文件就是数据和参数的全排列组合数据,只不过以pickle文件的形式保存下来,方便后续操作。
prepare_inputs.py代码拆解分析
if data_avail:
    data = pd.read_csv('input.csv').dropna()
else:
    sim = make_multilabel_classification(n_samples = 430,
                                         n_features = 137,
                                         n_classes = 8)
    data = pd.DataFrame(sim[0])
    data.columns = ['X' + str(i + 1) for i in data.columns]
    data['fila'] = np.random.uniform(-5, 5, len(data.index))
    data['filb'] = np.random.uniform(-5, 5, len(data.index))
    data['ycont'] = np.random.uniform(30, 80, len(data.index))
    data['ybin'] = data['ycont'] > 60
如果没有input.csv的话,就是自动生成一个430行,137+4列的一个数据。即每一行就是一个样本,每一列就是一个属性。
?
if data_avail:
    categ = pd.read_csv('categorical_items.csv')[['index', 'categorical']]
else:
    categ = pd.DataFrame({'index': list(data),
                          'categorical': np.concatenate([np.repeat(1, 137),
                                                         np.array([0, 0, 0, 1])])})
    categ.to_csv('categorical_items.csv')

#如果csv中的值为1,则该属性为类别变量
is_categ = categ['categorical'].values == 1

if debug==1:
    print(is_categ)

# Compute Gower distance matrix, 即任何两点之间的距离
gmat = gower.gower_matrix(data, cat_features=is_categ)

if debug==1:
    print(np.shape(gmat))
然后这段代码就是告诉gower函数(一个距离计算函数),哪些属性是类别属性,哪些是不是。得到的结果就是430*430的一个距离矩阵。
# Define filters ==============================================================
fil = {}

# MDS, with Gower distance matrix, first two components,对距离矩阵MDS进行降维到2维
# n_components,它确定了降维的维数
fil['mds'] = MDS(n_components=2,
                 dissimilarity='precomputed').fit_transform(gmat)


# MADRS, BDI, PRS, 就下面这三个是连续型变量
fil['fila'] = data['fila'].values
fil['filb'] = data['filb'].values
fil['ycont'] = data['ycont'].values

# Create combinations of the above
for j in ['fila', 'filb', 'ycont']:
    fil['mds' + '_' + j] = np.column_stack([fil['mds'], fil[j]])
我认为这一段是存放filter函数(论文中的)的结果的值,然后这里的值就是之前自己随机生成的。得到的fil值如下:
| mds | fila | filb | ycont | mds_fila | mds_filb | mds_ycont |
| 2列 ? | 1列 | 1列 | 1列 | 3维 | 3列? ? ? ? | 3列 |
# Define clustering algorithm =================================================
# 使用DBSCAN密度聚类算法
cluster = [DBSCAN(eps=i, metric='precomputed')
           for i in[0.5, 1, 5, 10, 50, 100]]
cluster.append(AgglomerativeClustering(affinity='precomputed',
                                       linkage='average'))
cluster.append('auto')
定义使用的密度聚类算法参数(可以自学一下密度聚类DBSCAN)。
# Define resolutions ==========================================================
resolutions = [(res, c)
               for res in [1, 3, 5, 10, 30, 50]
               for c in cluster]
resolutions.append((np.nan, None))
这两个for循环的目的就是让res(论文中的分辨率)参数和之前定义的聚类参数进行一个全排列组合。
params = [{'fil': f,
           'res': r,
           'gain': gain}
          for f in fil.items()
          for r in resolutions
          for gain in [0.1, 0.2, 0.3, 0.4]]
这三个for循环就是对fil数据,之前分辨率和聚类组合,以及gain(论文中的重叠区域)进行一个排列组合。(论文中说的很清楚为什么需要这样做)。
之后的代码就是将这些组合参数保存到pickle文件里,一些其他数据都保存在对应的文件中。